

Over the years, the obituary of the 60/40 portfolio- a reference to the balanced investment approach for an average investor, a mix of 60% stocks and 40% bonds- has been written more times than we can count. It’s been declared broken, dead, and ill-conceived. The grave has been dug, dirt filled-in, and the pallbearers, along with the executioners, have danced on the grave. It’s ironic that the cries have grown the loudest this year. The year where “The Walking Dead “ wrapped a 12-year run on television. More than 3 million people tuned in for the final episode, so don’t act like you gave up on it after Rick and the gang left the prison. If you prefer dragons to zombies, then lest you forget the mantra of the Drowned God and the Iron Islands: “What is dead may never die, but rises again harder and stronger.”And well, if you’ve dismissed two of the largest television series in the last 20 years, then feel free to just read along and understand why now more than ever, the 60/40 portfolio is alive and kicking.
New Low Score
As recent as the middle of October this year, the 60/40 portfolio was in the midst of one of its worst drawdowns on record. Here’s a look at the worst calendar year returns for the blended allocation on record:
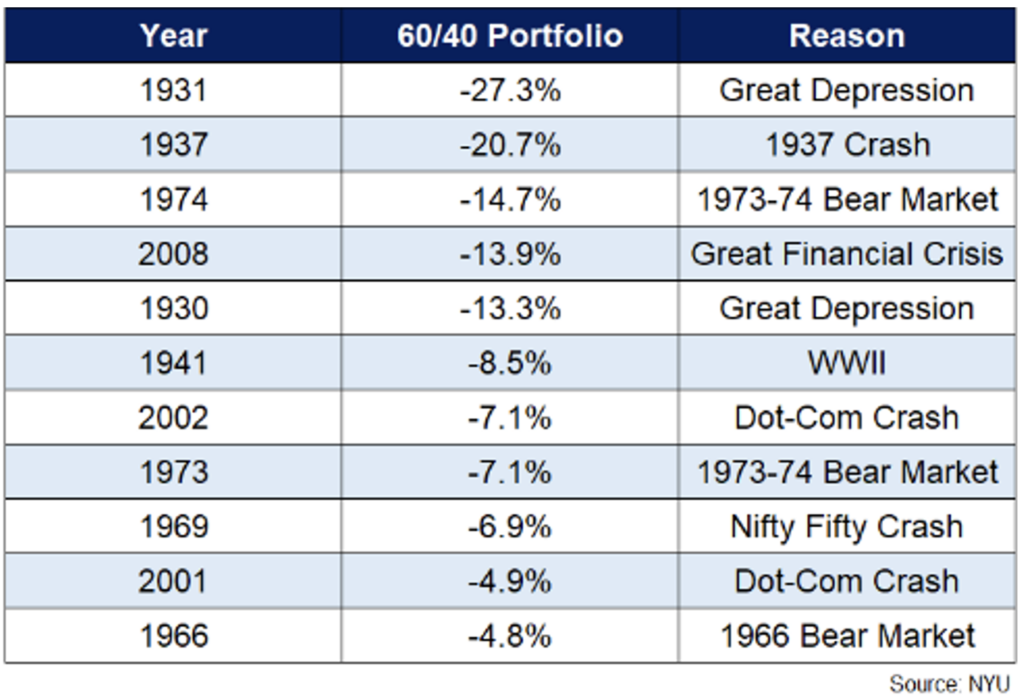
Through October 14th, the 60/40 portfolio had posted a -21% YTD return- the trough for the year through the month of November [1]. The first half of this year saw a drawdown for the portfolio that exceeded any drawdown in the first 6 months of a calendar year on record since the start of the two indices [2]. New lows might make 2022 a banner year, but they’re not exactly banners you want in the rafters. I think we’ll elect to keep these trophies in the basement. In a box. Triple taped.
What’s been tragically unique about 2022 has been the equal opportunist nature of the beating the market has handed out. Most equity investors know what they’re signing up for (emphasis on most). But more risk-averse investors who favor the fixed income side of the capital stack, have been handed their first rug pull in over 4 years. To rub salt in the wound, even the “safest” segments of the bond market have faired worse than equities- by a wide margin.
The argument that the doomsayers would use in the more recent obituaries all referenced the fact that bond yields were barely hovering above 0 for years. That the winds at the back of bond investors for roughly forty years were destined to change course. In the bond market, what goes down, must come up. Check out what the last few decades have looked like for a bond investor:
[1] Data provided by Bloomberg database.
[2] Bank of America Merrill Lynch.
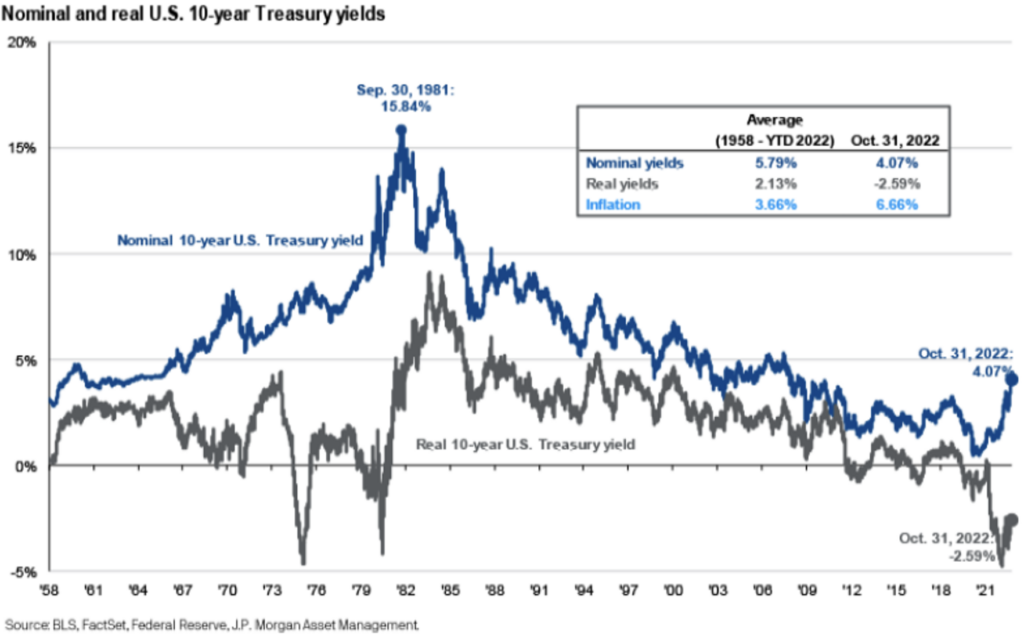
With yields off the mat, I think it might be time to declare the “40” in the 60/40 portfolio back from the dead.
Most investors aren’t exclusively allocating to Treasuries in their fixed income sleeve, so even a look at the broader fixed income market would support the idea that bonds are back:
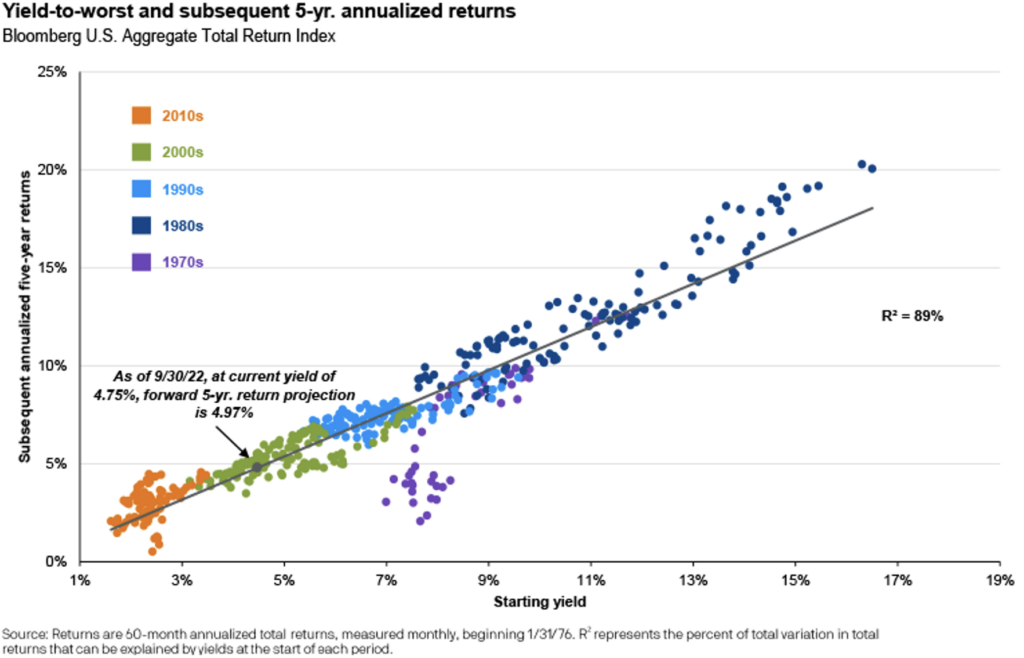
[3] Chart provided by J.P. Morgan, data as of 9/30/2022.
It should be pretty intuitive for investors that the expected return on a fixed income investment carries a pretty strong relationship to the yield at purchase. Looking at the chart above, it seems to me that the expected return for fixed income (the “40”) is approaching heights not seen in over a decade. Does that sound broken to you?
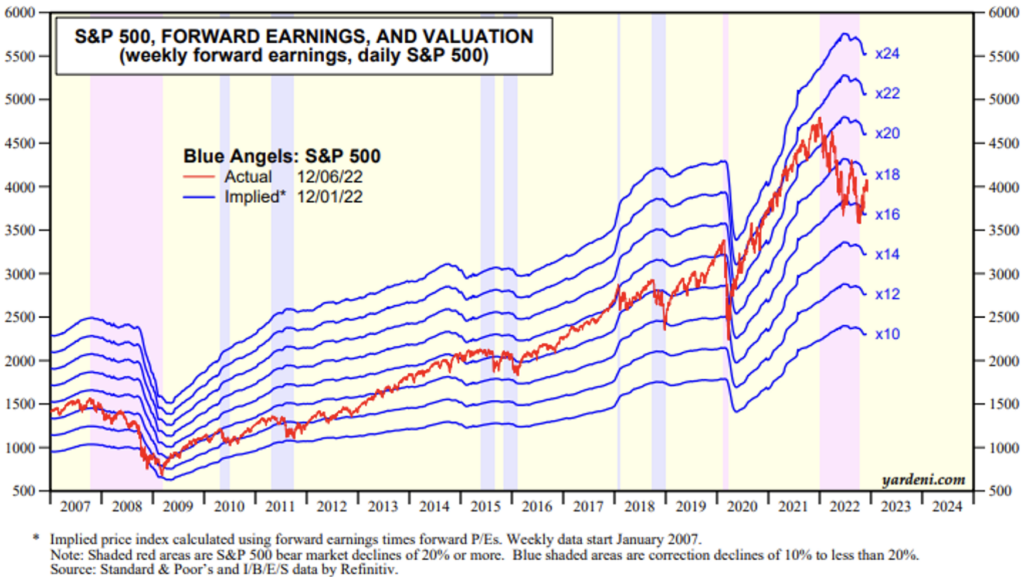
How about the equity side (the “60”)? Well, the S&P 500 has seen a peak to trough multiple compression this year of ~38%. From its peak in 2021, the Forward Price to Earnings multiple on the index has compressed by more than 45% [4]. Don’t take my word for it, check out the chart below:
Similar to bonds, the valuation/multiple at the point of purchase for an equity investor carries a meaningful implication for the forward expected returns. Check it out:
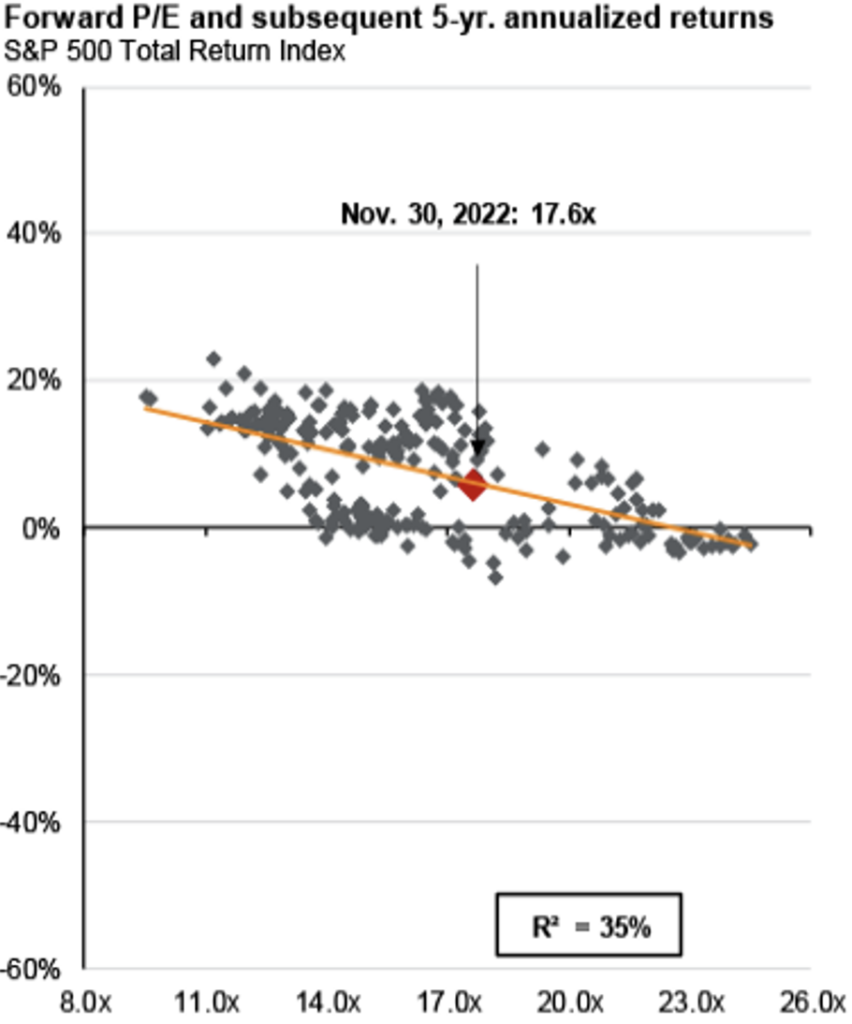
[4] Data provide by Bloomberg database.
[5] Chart provided by J.P. Morgan, data as of 11/30/2022.
Conceptually it’s pretty straight forward: the less you pay, the less you need to generate in return to clear your hurdle. A lower valuation at purchase for equity investors also allows for greater multiple expansion in the future, once sentiment turns more positive deeper into a new cycle. Purchasing equities with an elevated valuation provides a headwind for equity investors in the future.
So, to recap, we’ve seen bonds reach valuations to the downside that haven’t been offered to investors in more than 15 years and equities have kissed a multiple that has only been seen 6 times since 2013. Investors have been able to systematically put money to work in a 60/40 portfolio this year with an indicative yield on Treasuries of ~4.5% and a multiple on equities in the mid-teens. Dead?
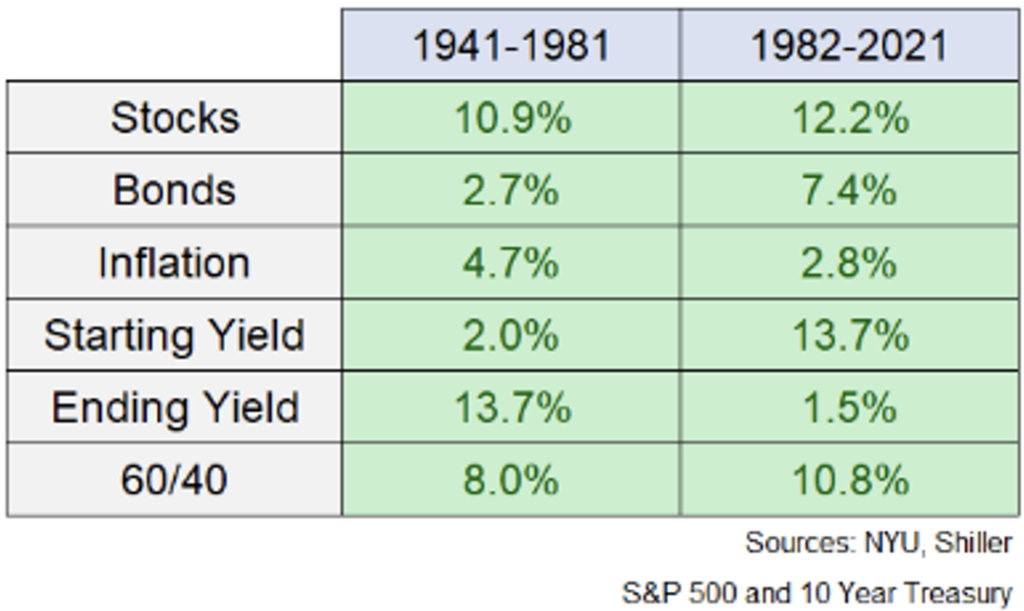
Has 2022 been a rough campaign? We’ve acknowledged that it has. But most investors, especially those invested in a 60/40 portfolio, are long-term in nature. I’d implore them to do everything they can to fight recency bias whenever, and wherever, it creeps in. The same way investors should look deep into the future for what value their portfolio is providing them today, we can all analyze history to see just how effective a moderately diversified portfolio has been during previous decades.
The falling interest rate and inflation rate regime we’ve been in since the early-1980s has been particularly good for financial assets. It shouldn’t be surprising that a mix of stocks and bonds had served investors well.
The last forty years might still fall into the recency bias camp, however. So, what about the forty that preceded them? Well, those four decades were the complete opposite of the road we’ve been on. Interest rates rose, inflation was higher than average and rising, and bonds performed poorly. How’d the 60/40 do?
It’s interesting to me that market pundits would declare a philosophy (basic diversification) dead, even when the data seems to be so clearly against the notion. But it’s not totally surprising that the noise around the subject has been turned up. In periods of market stress- like this year- correlations tend to tighten to 1; and there’s seldom any hiding places at times. And as the saying goes, “the higher the VIX, the higher the clicks.” So sure, fresh eulogies are being written and passed around like we’re living in the newsie’s era. But any investor who has time on their side should be viewing a blended 60/40 portfolio with fresh eyes today, and a perspective that resiliency has been a feature of the approach in the past. And today, the opportunities in front of these portfolios are the brightest they’ve been in years.
LEGAL STUFF
CURRENT MARKET DATA IS AS OF 12/2/2022. OPINIONS AND PREDICTIONS ARE AS OF 12/2/2022 AND ARE SUBJECT TO CHANGE AT ANY TIME BASED ON MARKET AND OTHER CONDITIONS. NO PREDICTIONS OR FORECASTS CAN BE GUARANTEED. INFORMATION CONTAINED HEREIN HAS BEEN OBTAINED FROM SOURCES BELIEVED TO BE RELIABLE BUT IS NOT GUARANTEED.
THIS MATERIAL DOES NOT CONSTITUTE A RECOMMENDATION TO BUY OR SELL ANY SPECIFIC SECURITY, PAST PERFORMANCE IS NOT INDICATIVE OF FUTURE RESULTS. INVESTING INVOLVES RISK, INCLUDING THE POSSIBLE LOSS OF A PRINCIPAL INVESTMENT.
THIS PRESENTATION (THE “PRESENTATION”) HAS BEEN PREPARED SOLELY FOR INFORMATION PURPOSES AND IS NOT INTENDED TO BE AN OFFER OR SOLICITATION AND IS BEING FURNISHED SOLELY FOR USE BY CLIENTS AND PROSPECTIVE CLIENTS IN CONSIDERING GFG CAPITAL, LLC (“GFG CAPITAL” OR THE “COMPANY”) AS THEIR INVESTMENT ADVISER. DO NOT USE THE FOREGOING AS THE SOLE BASIS OF INVESTMENT DECISIONS. ALL SOURCES DEEMED RELIABLE HOWEVER GFG CAPITAL ASSUMES NO RESPONSIBILITY FOR ANY INACCURACIES. THE OPINIONS CONTAINED HEREIN ARE NOT RECOMMENDATIONS.
INDEX PERFORMANCE IS PRESENTED FOR ILLUSTRATIVE PURPOSES ONLY. DIRECT INVESTMENT CANNOT BE MADE INTO AN INDEX. THE S&P 500 INDEX IS AN UNMANAGED INDEX, WHICH IS WIDELY REGARDED AS THE STANDARD FOR MEASURING THE U.S. STOCK MARKET PERFORMANCE. INVESTMENT IN EQUITIES INVOLVES MORE RISK THAN OTHER SECURITIES AND MAY HAVE THE POTENTIAL FOR HIGHER RETURNS AND GREATER LOSSES. BONDS HAVE INTEREST RATE RISK AND CREDIT RISK. AS INTEREST RATES RISE, EXISTING BOND PRICES FALL AND CAN CAUSE THE VALUE OF AN INVESTMENT TO DECLINE. CHANGES IN INTEREST RATES GENERALLY HAVE A GREATER EFFECT ON BONDS WITH LONGER MATURITIES THAN ON THOSE WITH SHORTER MATURITIES. CREDIT RISK REFERES TO THE POSSIBLITY THAT THE ISSUER OF THE BOND WILL NOT BE ABLE TO MAKE PRINCIPAL AND/OR INTEREST PAYMENTS.
THE INFORMATION CONTAINED HEREIN HAS BEEN PREPARED TO ASSIST INTERESTED PARTIES IN MAKING THEIR OWN EVALUATION OF GFG CAPITAL AND DOES NOT PURPORT TO CONTAIN ALL OF THE INFORMATION THAT A PROSPECTIVE CLIENT MAY DESIRE. IN ALL CASES, INTERESTED PARTIES SHOULD CONDUCT THEIR OWN INVESTIGATION AND ANALYSIS OF GFG CAPITAL AND THE DATA SET FORTH IN THIS PRESENTATION. FOR A FULL DESCRIPTION OF GFG CAPITAL’S ADVISORY SERVICES AND FEES, PLEASE REFER TO OUR FORM ADV PART 2 DISCLOSURE BROCHURE AVAILABLE BY REQUEST OR AT THE FOLLOWING WEBSITE: HTTP://WWW.ADVISERINFO.SEC.GOV/.
ALL COMMUNICATIONS, INQUIRIES AND REQUESTS FOR INFORMATION RELATING TO THIS PRESENTATION SHOULD BE ADDRESSED TO GFG CAPITAL AT 305-810-6500.