

“Congress shall make no law respecting an establishment of religion or prohibiting the free exercise thereof, or abridging the freedom of speech, or of the press; or the right of the people peaceably to assemble, and to petition the government for a redress of grievances.” James Madison wasted no time putting the people on notice. ‘Carry on in your personal life, the government won’t inject itself into your day to day restricting how you speak or think.’ Overtly, anyways. As much as separation of church and state has been deeply engrained in our DNA as Americans since the jump, we think the first amendment stands to be, well, amended. How’s this: “Investors shall make no attempt to mix their partisan affiliation and their portfolio, especially in an election year.” Separation of party and portfolio has long been our mantra. With the midterm elections upon us, we’d like to take a second to remind investors of this once again.
Leadership Matters…Right?
It’s natural for investors to see elections as events with significant and material implications for markets. While on paper it would seem like a pretty straight forward arithmetic exercise, but in reality, it’s a bit more nuanced than that. Excuse us for breaking our own rule about noise for a second. The reality is, elections tend to be nothing more than a source of anxiety for markets during the build-up. More on this in a second.
Midterm elections, naturally, aren’t significant macro events the way general elections are. They’re a bit more of a political show from the perspective of investors. (However, we couldn’t stress the importance of voting enough. If you need help figuring out how, click here.) What’s at stake here is, will you continue to see a unified governing power in Washington, or will we revert to a gridlock split government body, the way we’ve seen the vast majority of the time? In a few weeks we’ll have an answer to that question, and then a laundry list of questions for each possible outcome. But let’s look as to why, historically, investors shouldn’t concern themselves with one result over another.
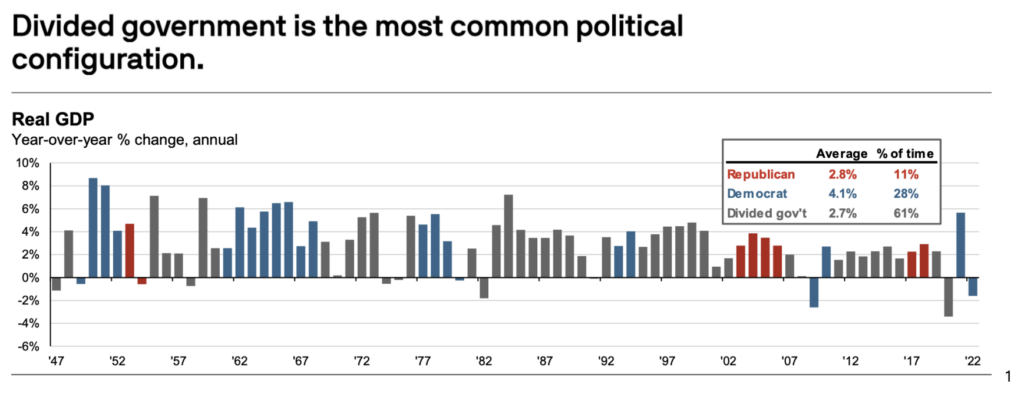
Chart provided by J.P. Morgan. As of August 2022.
You see? Most of the time, we hardly get along when it comes to who gets to make the rules. In fact, we tend to let allow whether or not our own political party successfully called shotgun, dictate (pun intended) our perception of the economy. Checkout the chart below from JP Morgan:
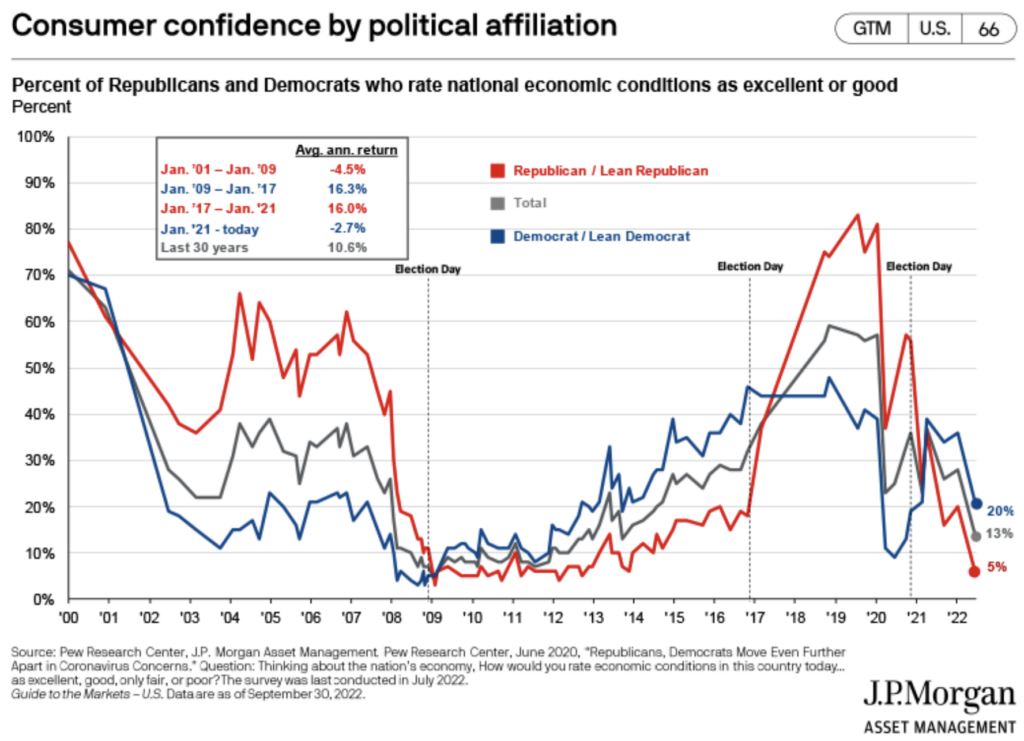
Chart provided by J.P. Morgan.
Now, if we so clearly are influenced by the political circus, wouldn’t you support my imitative to amend the first amendment?
I’m kidding, this isn’t a stump speech. But there’s a connection to be made between just how polarizing we seem to be as a collective society (above chart) and the behavior of markets leading up to and coming out of elections.
Check out the chart below from JP Morgan that tracks the S&P 500 in the 100 days leading up to and 100 days following the midterm election date over the last 10 midterms:
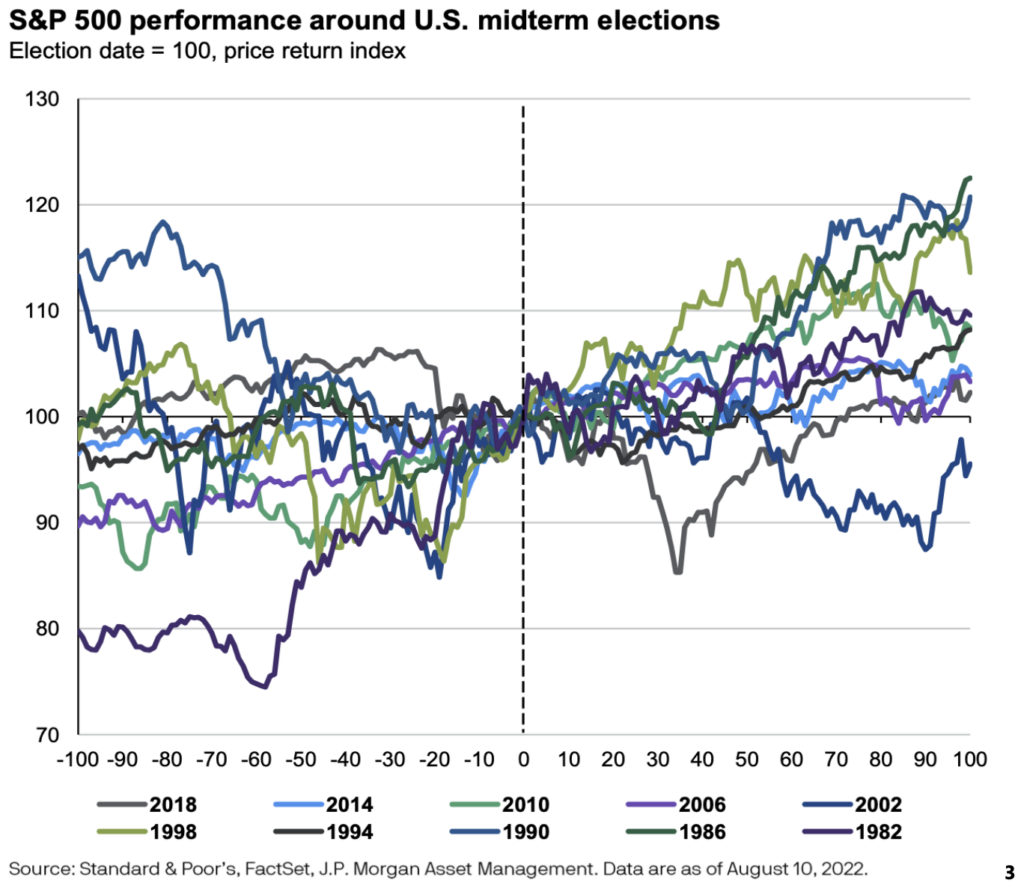
Chart provided by J.P. Morgan.
An awfully similar pattern to our perception of the economy surrounding elections. It’s almost as if we allow for emotional and cognitive biases infiltrate our portfolios. But what’s most important here is what has consistently happened after that dotted line (election day).
Time after time, markets have gone on to rally following election day, regardless of the outcome. Why? It’s one less unknown variable for our lizard brains to pontificate about. Here’s every single midterm election cycle since 1947:
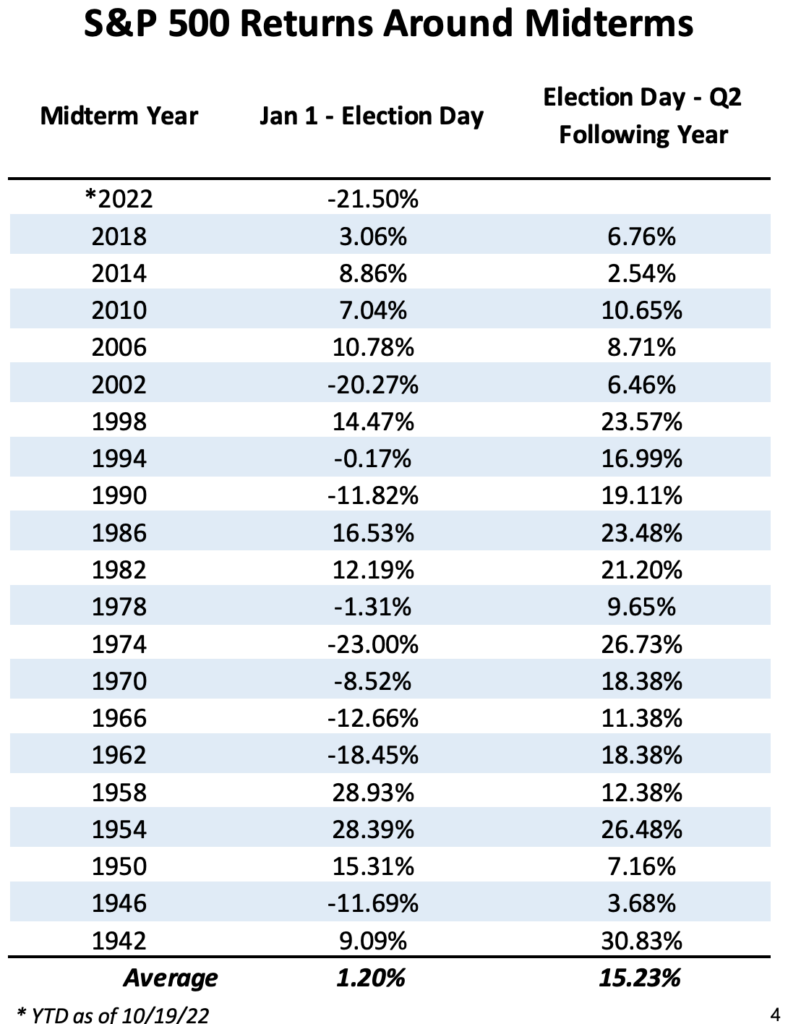
That’s what’s called “batting a thousand”. The S&P 500 has posted positive returns 20 out of 20 times throughout history in the following 2 2/3 quarters after a midterm election. Thirteen of those periods saw double digit returns and six of them registered a total return more than 20% by the end of the following second quarter. In fifteen of these years, the return for the S&P 500 following the midterms was greater than the performance leading up to them.
The market anomaly of the Presidential Cycle is one that’s well documented. In fact, when you look at the market through the lens of the 4-year Presidential term, year two is the worst performing year of the 4 year cycle. Here’s a look at the Dow Jones Industrial Average, the S&P 500, and the Nasdaq 100 tracking the 4-year cycle:
Data provide by Bloomberg database. As of 10/19/22.
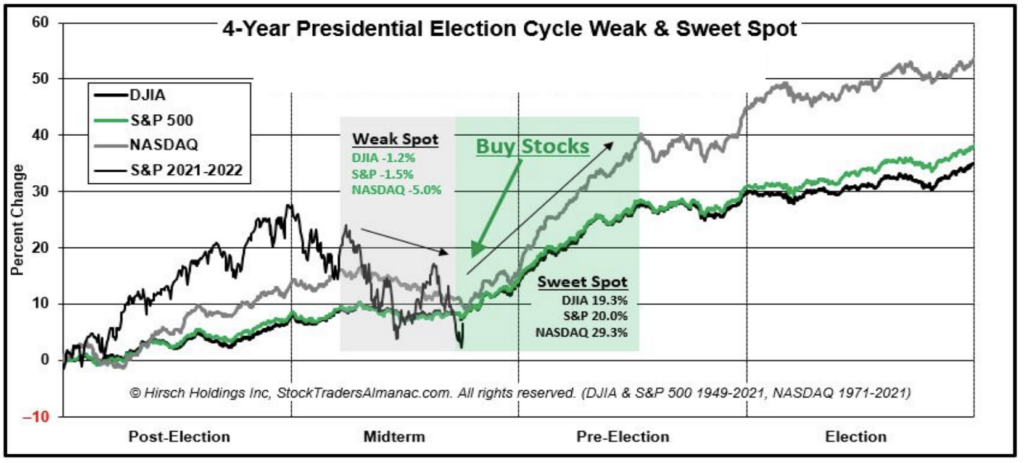
Chart provided by Hirsch Holdings.
What if I told you that on top of year 2 being the weakest year for stocks during the cycle, that year 2 Q2 is the worst quarter of the 16 quarters? Well, this year that has held true as well. The S&P 500 was down by more than 16% in the second quarter this year, making it the weakest of the 3 that’ve completed in 2022.
Have you seen the data regarding the best days in the market tend to be immediately following the worst days in the market7? Well, what if I told you, the best quarters in a Presidential Cycle are Q4 Year 2- Q2 Year 3? That’s the story that markets have told throughout their history. It’s an interesting abnormality, but nonetheless, it’s a reality.
Anomalies are anomalies for a reason. If you allow me to try to rationalize this one, what I think happens in this period is a build-up and subsequential release of pent-up political tension. But what’s unique about a midterm election, as opposed to a general election, is most commonly Washington D.C. isn’t much of a factor for markets and policy following a midterm election. You don’t have the threat of a potential new administration taking control, implementing a suite of polices that could impact markets, on the margin, down the road. Instead, we remove one more “unknown” from our system of daily discounting (aka the stock market). In doing so, we gain just a smidge more confidence and certainty of what the future will look like.
Don’t take my word for it. I’m looking at the same data everybody else is. But if you don’t care for my interpretation of it, that doesn’t change the data. What I hope investors do take away from this note is, even if you’re down bad because your choices don’t fair too well on election day, don’t let that carryover into your portfolio. History has shown, the market doesn’t care who’s in charge.
Data provided by Bloomberg database.
As of year-end 2021, seven of the best days have occurred within two weeks of their corresponding worst day; often the spread is much closer than that. For example, March 12, 2020 was the second-worst day of the year, and was immediately followed by the second-best day of the year. Moreover, the worst days overwhelmingly occur before the best days: over the last 20 years, six of the seven best days occurred after the worst day.
LEGAL STUFF
CURRENT MARKET DATA IS AS OF 10/18/2022. OPINIONS AND PREDICTIONS ARE AS OF 10/18/2022 AND ARE SUBJECT TO CHANGE AT ANY TIME BASED ON MARKET AND OTHER CONDITIONS. NO PREDICTIONS OR FORECASTS CAN BE GUARANTEED. INFORMATION CONTAINED HEREIN HAS BEEN OBTAINED FROM SOURCES BELIEVED TO BE RELIABLE BUT IS NOT GUARANTEED.
THIS MATERIAL DOES NOT CONSTITUTE A RECOMMENDATION TO BUY OR SELL ANY SPECIFIC SECURITY, PAST PERFORMANCE IS NOT INDICATIVE OF FUTURE RESULTS. INVESTING INVOLVES RISK, INCLUDING THE POSSIBLE LOSS OF A PRINCIPAL INVESTMENT.
THIS PRESENTATION (THE “PRESENTATION”) HAS BEEN PREPARED SOLELY FOR INFORMATION PURPOSES AND IS NOT INTENDED TO BE AN OFFER OR SOLICITATION AND IS BEING FURNISHED SOLELY FOR USE BY CLIENTS AND PROSPECTIVE CLIENTS IN CONSIDERING GFG CAPITAL, LLC (“GFG CAPITAL” OR THE “COMPANY”) AS THEIR INVESTMENT ADVISER. DO NOT USE THE FOREGOING AS THE SOLE BASIS OF INVESTMENT DECISIONS. ALL SOURCES DEEMED RELIABLE HOWEVER GFG CAPITAL ASSUMES NO RESPONSIBILITY FOR ANY INACCURACIES. THE OPINIONS CONTAINED HEREIN ARE NOT RECOMMENDATIONS.
INDEX PERFORMANCE IS PRESENTED FOR ILLUSTRATIVE PURPOSES ONLY. DIRECT INVESTMENT CANNOT BE MADE INTO AN INDEX. THE S&P 500 INDEX IS AN UNMANAGED INDEX, WHICH IS WIDELY REGARDED AS THE STANDARD FOR MEASURING THE U.S. STOCK MARKET PERFORMANCE. INVESTMENT IN EQUITIES INVOLVES MORE RISK THAN OTHER SECURITIES AND MAY HAVE THE POTENTIAL FOR HIGHER RETURNS AND GREATER LOSSES. BONDS HAVE INTEREST RATE RISK AND CREDIT RISK. AS INTEREST RATES RISE, EXISTING BOND PRICES FALL AND CAN CAUSE THE VALUE OF AN INVESTMENT TO DECLINE. CHANGES IN INTEREST RATES GENERALLY HAVE A GREATER EFFECT ON BONDS WITH LONGER MATURITIES THAN ON THOSE WITH SHORTER MATURITIES. CREDIT RISK REFERES TO THE POSSIBLITY THAT THE ISSUER OF THE BOND WILL NOT BE ABLE TO MAKE PRINCIPAL AND/OR INTEREST PAYMENTS.
THE INFORMATION CONTAINED HEREIN HAS BEEN PREPARED TO ASSIST INTERESTED PARTIES IN MAKING THEIR OWN EVALUATION OF GFG CAPITAL AND DOES NOT PURPORT TO CONTAIN ALL OF THE INFORMATION THAT A PROSPECTIVE CLIENT MAY DESIRE. IN ALL CASES, INTERESTED PARTIES SHOULD CONDUCT THEIR OWN INVESTIGATION AND ANALYSIS OF GFG CAPITAL AND THE DATA SET FORTH IN THIS PRESENTATION. FOR A FULL DESCRIPTION OF GFG CAPITAL’S ADVISORY SERVICES AND FEES, PLEASE REFER TO OUR FORM ADV PART 2 DISCLOSURE BROCHURE AVAILABLE BY REQUEST OR AT THE FOLLOWING WEBSITE: HTTP://WWW.ADVISERINFO.SEC.GOV/.
ALL COMMUNICATIONS, INQUIRIES AND REQUESTS FOR INFORMATION RELATING TO THIS
PRESENTATION SHOULD BE ADDRESSED TO GFG CAPITAL AT 305-810-6500.