

If there were a Spotify Wrapped for financial markets in 2022, I’d imagine the top played hits for the year would look something like: “Inflation” by Pandemic Overhang, “Hike Me Baby One More Time” by J-Powell & The Gang, “Recession” by The Doomsayers, “Sound of Silence” as performed by The Reformed Day Traders, and “All Falls Down” by The Bloomberg Index Duo. Perhaps a New Year’s resolution for the market could be freshening up its playlists. But when you sit back and look at the calendar year that was 2022, some of the hits on that list were on repeat all year long. The year was dominated by the narrative surrounding inflation and the Fed’s ability (or lack thereof) to reign in the residual impact from the pandemic. And subsequentially, how long, and high would the Fed go with monetary policy, and whether pushing the pedal to the floor would send the U.S. economy into recession. Pain was in abundance for the market, in just about every asset class throughout the year- you’d be hard pressed to find an asset class that didn’t correct by at least 10% by the middle of the summer. As we try to assess the environment at the start of 2023, let’s first take a close look at where we’ve found ourselves to start the 2023 campaign.
Shake It Out
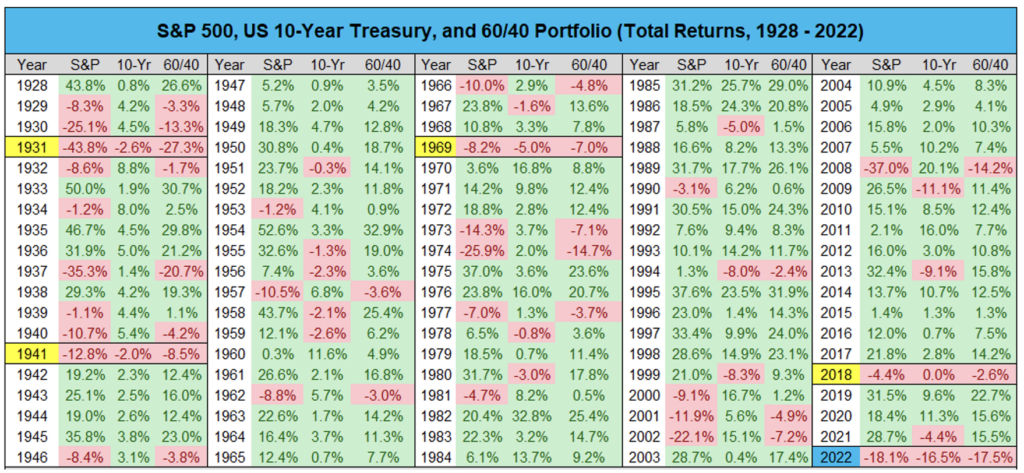
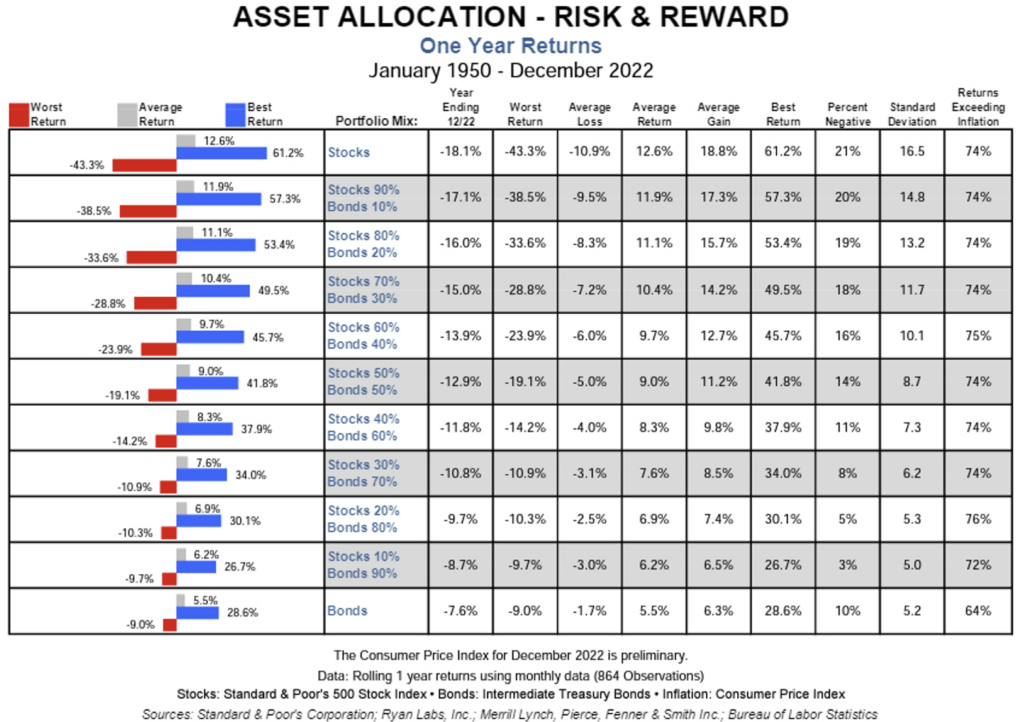
Pain was the forecast last year. In the two largest asset classes in the world, investors subject to record setting losses, and in some instances, they were happening in what are known to be the “safer” asset classes in the world [1]. Here’s a look at the calendar year returns for U.S. equities, Government Bonds, and a blend of the two in a 60/40 portfolio [2]:
[1] All investing involves risk, including the loss of a principal investment.
[2] Data provided by Bloomberg. Chart provided by Charlie Bilello, Director of Research at Pension Partners LLC.
Since 1928, there have only been 5 instances where U.S. stocks and U.S. Government bonds were negative for the year. Last year managed to be the 5th year on record, but also, in remarkable fashion, it turned out to be the first time in history we saw double digit negative returns for each asset class.
The -15.6% return for bonds is well out of the ordinary that investors should reasonably expect from their safe(r) haven investments. The -18% decline in stocks might come across as something that is within the norm for equities, to some investors. But it’s actually quite rare to see such a deeply negative year for stocks [3]:
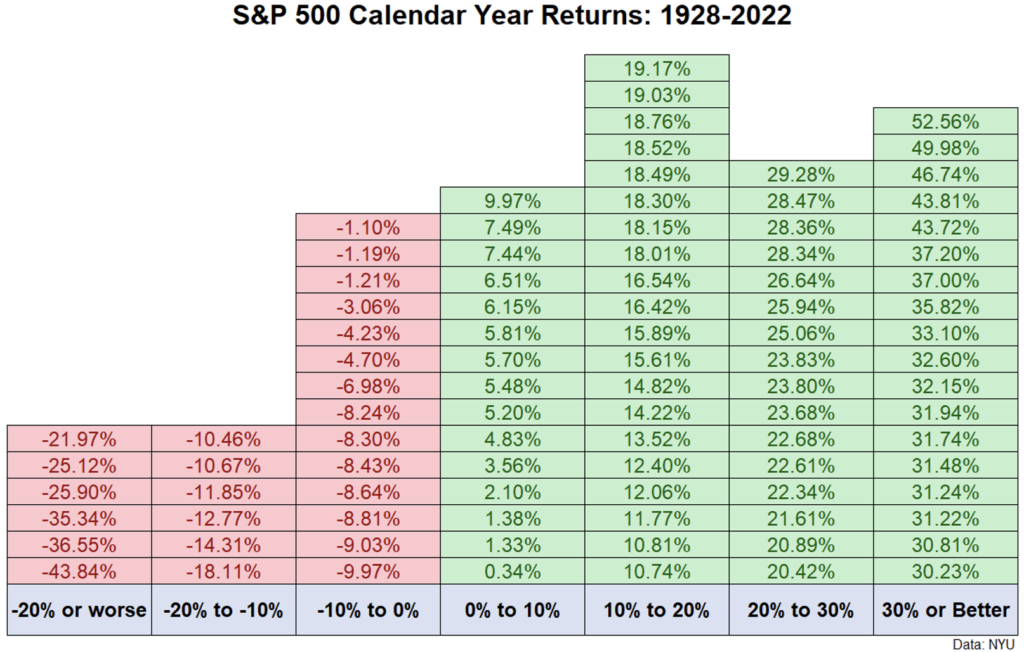
[3] Data and chart provided by NYU Stern.
The strange thing about investing in stocks is any given year rarely gives you anything close to the historical range of returns. That’s why one prediction I think any investor would be safe to make is you’re not likely to see an “average” return for equities this coming calendar year. The odds of gaining >20% in a year are 5.7x more likely than losing >20% based on historical market trends [4].
A quick lesson in humility that we can take away from this is to never be too sure of your market predictions (or anybody else’s, for that matter). Volatility of this nature is the purest illustration of investor psyche and the fickleness we are capable of.
Now, back to our regularly scheduled programming:
What can investors begin to expect after surviving a year like we just did? The carnage of 2022 is actually what has us so bullish on markets as we look ahead. In fact, we spent a whole blog post on it last month, so we won’t totally rehash it here. But we encourage you to give it 10 minutes of attention.
Using the same long-term analysis period as above, the stock market generally moves high in a given year. In fact, 3 out of 4 years stocks are positive by New Year’s Eve. Fifty-five percent of the time, investors have experienced back-to-back years with positive returns [5].
As for negative years? Well, we know that stocks are negative roughly 25% of the time over the last 95 years. But only 9% of the last 95 years have seen back-to-back negative calendar years for stocks [6]. And what has been the expectation historically at the start of the year, following a previously negative year for stocks? The conditional probability would say when stocks post a negative calendar year, there’s been a 30% of the next year also winding up negative.
In other words, there isn’t much deviation from the expectations in a random year with no conditional variables at play. Which is why we believe that investors should not get too caught up on negative momentum in sentiment or price carrying over into the new year. Instead, focusing on the valuation of these asset classes should help form an investor’s expectation of what’s to come.
Stocks and bonds are entering the new year at exceptionally more attractive valuations than where we were a year ago. At the start of 2022, the yield on the 10-Year was off its lows, but still hovering at about 1.5%.
Today, the 10 year is yielding 3.87% on January 1st. The yield on the U.S. Aggregate Bond Index at the start of the year was 4.70% [7]. Both promising, useful returns on investor capital on a forward-looking basis. Something that hasn’t been present for almost a decade. Not to mention the front end of the yield curve is still offering investors a yield above 4.5%. Higher yields are a gift to investors who have long been starved for income. And investors don’t have to go far up the risk spectrum to receive it. Short-term government bonds and mortgage securities are appealing for that reason. High-grade credit yields also now compensate for recession risks.
For stocks, we’re entering a year where the Forward Price to Earnings ratio on the S&P 500 is sitting at about 16.5x[8]. Roughly 25% lower than the multiple the market entered 2022 with. If you’re an investor who’s allocating to both stocks and bonds in 2023- you’re putting capital to work at a much more attractive time than what we’ve seen in recent years, from a valuation perspective.
Short-term returns are promised to no one. It’s not out of the realm of possibility for markets to have a handful of bad years in a row. Most of the time good stuff happens in the markets. But sometimes bad stuff happens too. To survive over the long run, you need to make sure you bake both outcomes into your expectations.
[4] Past performance is no guarantee of future results.
[5] Data provided by Bloomberg database.
[6] Data provided by Bloomberg database.
[7] Data provided by Bloomberg database.
[8] Data provided by Factset.
Inner City Blues
Last year, we shared a concept with investors that could help determine if and when the U.S. economy might be headed into a recession: tracking the state-by-state economic productivity. It might be easy for someone to forget that the U.S. GDP a function of all 50 states independently contributing to the total output for the country. So, naturally, one could track the economic productivity of each of the 50 states on a month to month, or rolling 3-month basis, to determine how the economic cycle is doing. Back in 2Q’22 zero of the fifty states were showing negative sequential economic productivity.
Today?
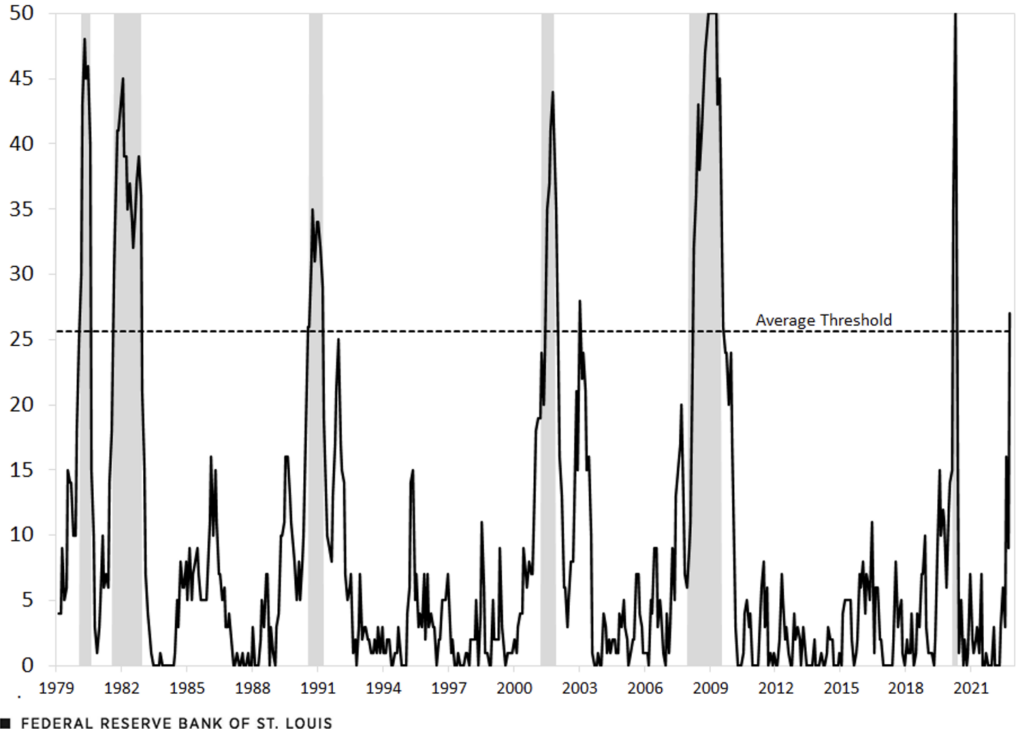
According to the Federal Reserve Bank of St. Louis (in the chart above), in October 2022, 27 states had negative growth on a month over month basis, in the state coincidence index (SCI). That would exceed the six-recession average (dotted line above) of 26 states but would fall short of the outlier-adjusted estimate (excluding 2008) of 29.
One caveat noting: The largest single state economies seem to have remained in positive economic growth through November of 2022. These largest economies (California, Texas, New York, and Florida) can very well help extend the current cycle or remain relatively insulated from a recession on a national level.
Anybody who is tracking the state of the economy (not just investors) should be mindful of the slower growth we’ve seen coming out of California in recent months, along with the potential shortfall in the state’s budget, given the exodus of high tax paying citizens migrated to other states over the last year.
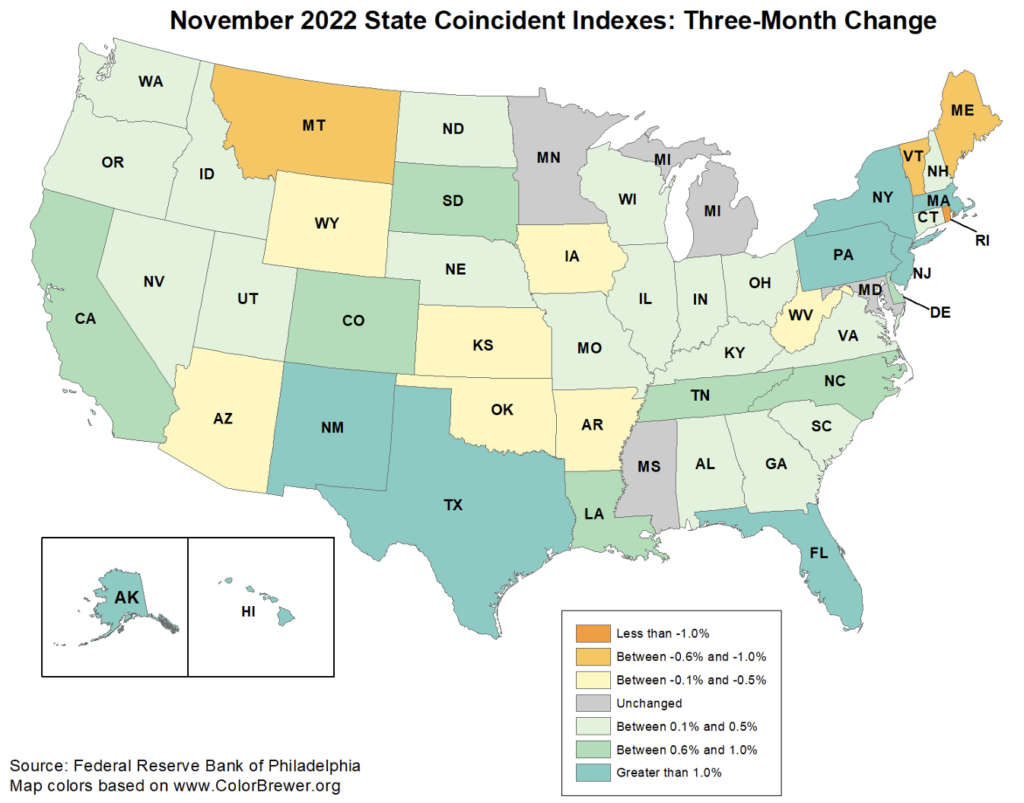
[9] Map provided by Federal Reserve Bank of St. Louis, as of November 2022.
For many, tracking the state-by-state economic productivity isn’t too high on their recession checklist. We hope that more armchair economists try to incorporate it into their musings on the economy though.
Depth Over Distance
The consensus view on the economy coming into 2023 seems to be an inevitable shallow recession arriving by the end of Q4 [10]:
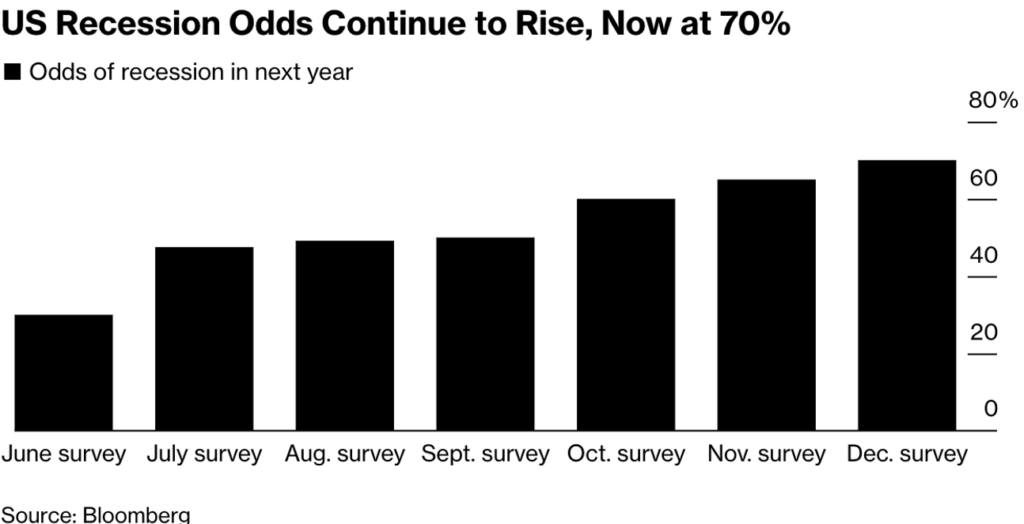
[10] A Bloomberg survey in December 2022 showed that 70% of economists polled predicted a recession manifesting in 2023.
[11] Chart provided by Bloomberg.
We’ll entertain the thought here for a minute, but we’d be remiss if we didn’t point out that there is some reason to believe a soft landing is feasible- but that’s a whole separate blogpost in and of itself.
For a minute, lets latch onto the notion that this inevitable recession is shallow in nature. Is that really what equity investors should be hoping for? In theory it sounds a bit less harmful than a very deep economic contraction. And sure, each recession we have experienced in the past and will experience in the future is likely to be unique and unapparelled in nature.
But to this point, depth of recessions seemingly has no bearing on the depth of contraction in equities[12]:
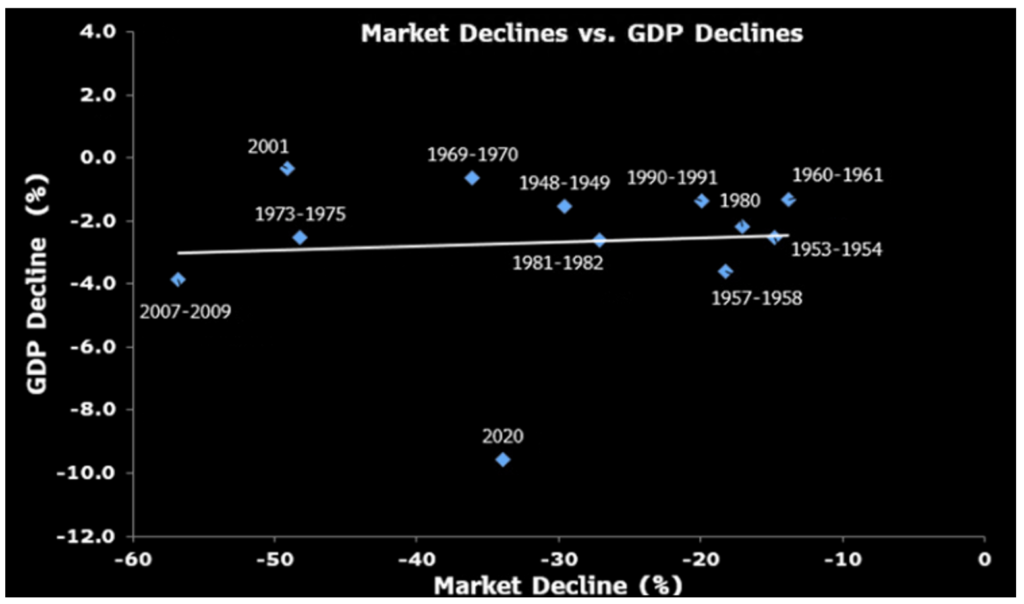
[12] Chart provided by Gina Martin Adams Global Head of Portfolio Strategy and Chief Equity Strategist for Bloomberg Intelligence, Bloomberg.
The depth of the drop in real GDP may matter less than the length of the recession to stocks. Research from the Bloomberg equity strategist team shows that, historically, the depth of peak-to-trough real GDP declines and the severity of stock moves have been uncorrelated.
Events such as the 2008-09 crisis saw sharp setbacks in GDP and stock prices, while the 2001 recession was relatively shallow but accompanied by a deep market selloff as Ponzi scheme related scandals (maybe they’re less unapparelled then I thought?) dragged equities to further lows. Likewise, the recession of 2020 had the sharpest peak-to-trough GDP decline on record, with a slightly above-average drop in the S&P 500.
The current S&P 500 drop extended to more than 25% from the index peak, putting it in a range with crashes tied with the 1981-1982 recession, which included a 2.6% decline in real GDP.
It turns out, the duration of economic contraction has historically played a tighter relationship with negative equity performance[13]:
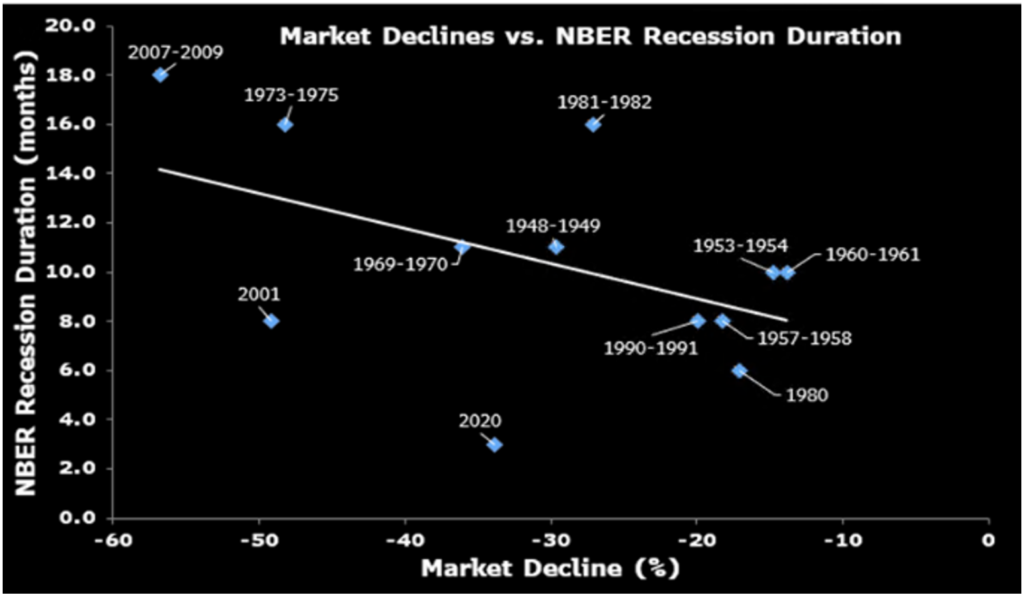
[13] Chart provided by Gina Martin Adams, Global Head of Portfolio Strategy and Chief Equity Strategist for Bloomberg Intelligence, Bloomberg.
The business-cycle peak hasn’t yet been declared by the National Bureau of Economic Research, but US GDP contracted for two consecutive quarters in early 2022, coincidentally to the beginning of the S&P500 ex-energy earnings decline. And expectations for growth in GDP have fallen sharply by most economists’ measures for the coming year.
Depending on when the official business-cycle peak is declared, the possible 2022-23 recession could be on the longer end, which has typically been accompanied by steeper stock-market declines. With the exception of 2001, 1981-82 and 2020, longer recessions have been generally affiliated with deeper drops in stocks since the 1940s.
I think if you spend some time on why these relationships are what they are, it’s a pretty simple explanation. The stock market is a forward discounting mechanism. And investors are constantly trying to price in “what’s next”. Well, if a recession proves to be more stubborn in duration than most investors have priced in, then the inevitable pushing out the discounting period we must end up doing.
That is, if you’re an equity analyst and you’ve priced in a recession into your earnings estimate for the market, but expect a return to positive trend growth in corporate earnings, you might be forced to extend the period you’ve tried to forecast a dip in profitability. Which in turn, could result in further temporary multiple expansion. Thus, this is how a bear market rally is born.
In general, the recession debate is a counterproductive way to view the macroeconomy in my opinion. It establishes a binary view of things, as if the economy is an on/off light switch when, in reality, the economy is more like a dimmer switch that moves along a spectrum of growth rates. In today’s environment, for instance, the switch is dimming. It’s not in the off position, but the risk of shifting to the off position appears to be rising. So, while we might not be in a technical recession the probability of finding ourselves in the “off” position is rising.
Do You Have To Let It Linger?
There seems to be a growing consensus, and comfort, with the current landscape of the markets and their immediate future. Some of the seemingly most agreed upon calls for the year were the out-of-consensus views just 3-4 months ago. Earnings recession? Everyone agrees. Economic recession? See above. Fed pause? Rates market seems to agree. Inflation turning to disinflation or even deflation? Well, it’s tough to hold the views of an imminent recession and a Fed pause, if you think inflation isn’t tamed.
But, what if it’s not?
Is this a risk that derails the investment optimism, and enhances the economic bearishness? It sure seems to fit well with the notion that a recession could turn out to be more prolonged than the market is trying to will it to be.
Over the last 24 months we’ve seen the Covid-19 pandemic, with a combination of massive fiscal policy and monetary intervention that actually was unprecedented. As the first leg of the pandemic seemed to be winding down (thanks to massive scientific and technological advancements) in the U.S. and Europe; China held firm on their Zero-Covid policy. This created a bifurcated recovery and wobbly reopening of the global economy. Sending disproportionate inflation shockwaves across the world. Finally, Russia’s invasion of Ukraine and the West’s sanctions in response put a strain on the global supply of energy, food, and fertilizer.
Despite the fastest 400bps move in the Fed Funds Rate on record last year, there still is a non-zero chance that inflation proves to be a bit more persistent than what the market is pricing in to start the year. Despite rapidly rising interest rates, driven by continued supply chain constraints and lingering pandemic-era “excess savings”- but also, critically, by persistently high energy prices that have an ever-present catalyst by way of the Ukraine and Russia war. The Fed can pretty much do close to nothing to help reign in these last few variables. And while the early year comps for energy prices will be favorable to the disinflation camp, a resurgent energy price in the back half of the year might give the Fed reason to feel the need to act.
Much of the Organization for Economic Co-operation and Development (OECD) is still experiencing inflation not seen in a generation. In fact, more than 10% of the countries are still experiencing inflation readings for the last 5 quarters above their respective 90th percentile [14]:
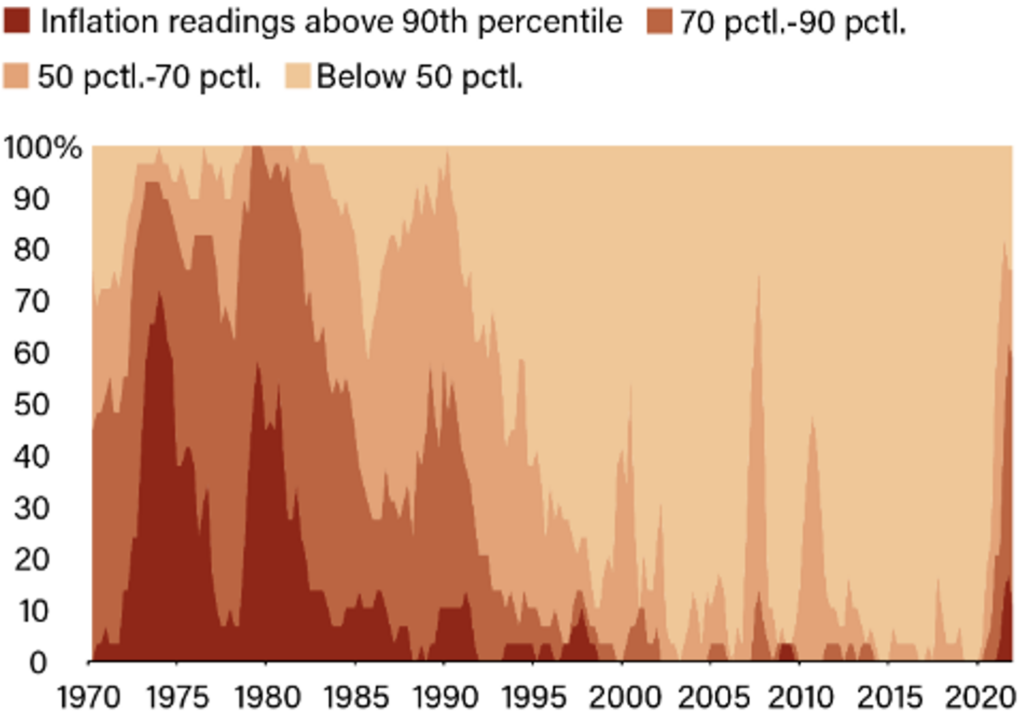
[14] IMF, Eurasia Group.
After a year spent pontificating how, when, and where the end of this cycle will materialize; it seems today that one of the biggest risks to markets might be our collective estimate might be too premature. The combination of persistent inflation this far into a rate hiking cycle, rates on the rise across the globe, and little to no fiscal help in the pipeline, can easily push the global economy into recession. Only time will tell, but fortunately we’ll likely have our answer in the next 180 days.
Rolling Loud
Call it routine, habit, or obsession; but every year at this time I like to encourage investors to try and break a terrible habit. It’s the same habit, every year. You could say investors are just as stubborn as I am.
No investor is comfortable with losing money. So, when our self-inflicted timing mechanism (the calendar) is telling us that time is running out, there is a natural tendency to become hyper-sensitive to our gains or losses. How can an investor defend themselves from our celestial obsession? By not losing site of rolling returns. You can use a variety of time frames, but we think the longer the rolling return timeframe, the stronger the message.
Looking at rolling returns, the chart below shows the S&P 500 has only three 20-year rolling period where returns were negative. Each of which took place before 1950. In other words: the S&P 500 has not experienced a negative rolling 20-year return period in over 70 years [15].
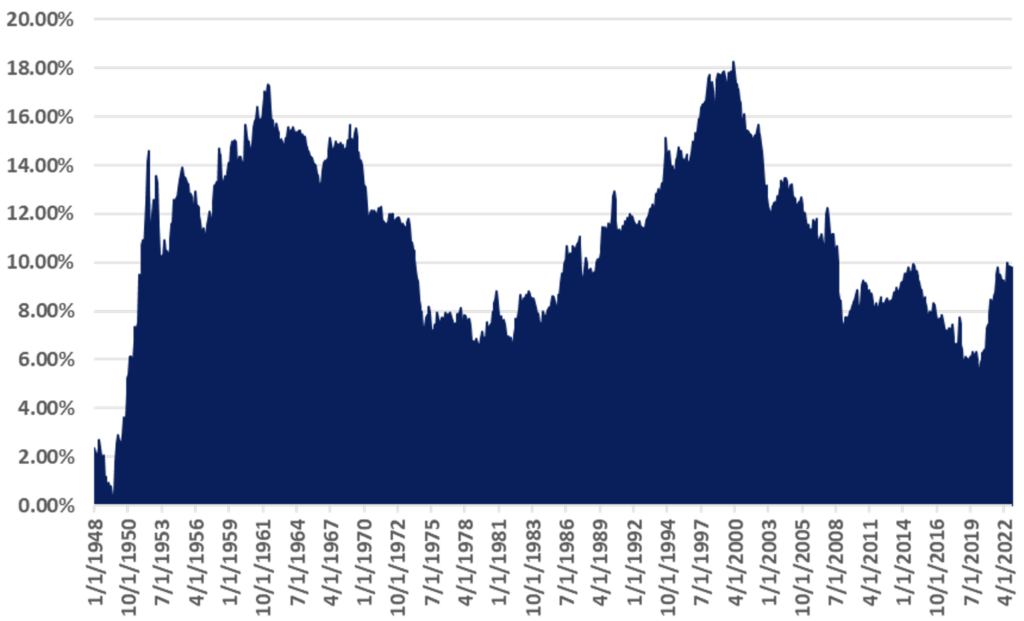
[15] Data provided by Bloomberg database; chart provided by GFG Capital. Data through 12/31/22.
Even shortening the time horizon to rolling 12 months as a substitute for the calendar year, you can see a clearer picture of consistency for a variety of asset classes:
We don’t think investors should dismiss years of struggle and bank on the averages working themselves out over the long-term. That would be pure ignorance, and ignorance isn’t bliss. Ignorance is suicide.
Ignoring weakness within the environment you’re presently in will increase the chances of you being met with something you’re not ready to handle and will potentially jeopardize where you intended to reach in the first place.
Being able to count on a long-term investment horizon is a blessing and a curse for investors. It often serves as a pacifier for times of struggle within the market, or disappointment within a portfolio. Like a disgruntled sports fan, “there’s always next year” is a consolation they can tell themselves knowing they still have future opportunities.
But when that reminder begins to lose its effectiveness, investors can start to press. Force trades, convince themselves new opportunities should be sought out or completely abandon the process that’s been put in place. The privilege of a long-term time horizon requires investors to possess the stamina necessary to survive it. While it’s true, a lengthy time horizon carries what might seem like endless possibilities to expand your wealth, it also can be dark and full of terrors at times.
Listen twice, speak once. A mantra Tupac Shakur once echoed when discussing the importance of taking in what’s happening around you before acting. Investors can take heed of this advice when it comes to observing their portfolio. Managing your emotions twice as much as you manage your portfolio is a good way to help build the stamina necessary to survive your long-term time horizon in the markets.
LEGAL STUFF
CURRENT MARKET DATA IS AS OF 12/31/2022. OPINIONS AND PREDICTIONS ARE AS OF 12/31/2022 AND ARE SUBJECT TO CHANGE AT ANY TIME BASED ON MARKET AND OTHER CONDITIONS. NO PREDICTIONS OR FORECASTS CAN BE GUARANTEED. INFORMATION CONTAINED HEREIN HAS BEEN OBTAINED FROM SOURCES BELIEVED TO BE RELIABLE BUT IS NOT GUARANTEED.
THIS MATERIAL DOES NOT CONSTITUTE A RECOMMENDATION TO BUY OR SELL ANY SPECIFIC SECURITY, PAST PERFORMANCE IS NOT INDICATIVE OF FUTURE RESULTS. INVESTING INVOLVES RISK, INCLUDING THE POSSIBLE LOSS OF A PRINCIPAL INVESTMENT.
THIS PRESENTATION (THE “PRESENTATION”) HAS BEEN PREPARED SOLELY FOR INFORMATION PURPOSES AND IS NOT INTENDED TO BE AN OFFER OR SOLICITATION AND IS BEING FURNISHED SOLELY FOR USE BY CLIENTS AND PROSPECTIVE CLIENTS IN CONSIDERING GFG CAPITAL, LLC (“GFG CAPITAL” OR THE “COMPANY”) AS THEIR INVESTMENT ADVISER. DO NOT USE THE FOREGOING AS THE SOLE BASIS OF INVESTMENT DECISIONS. ALL SOURCES DEEMED RELIABLE HOWEVER GFG CAPITAL ASSUMES NO RESPONSIBILITY FOR ANY INACCURACIES. THE OPINIONS CONTAINED HEREIN ARE NOT RECOMMENDATIONS.
INDEX PERFORMANCE IS PRESENTED FOR ILLUSTRATIVE PURPOSES ONLY. DIRECT INVESTMENT CANNOT BE MADE INTO AN INDEX. THE S&P 500 INDEX IS AN UNMANAGED INDEX, WHICH IS WIDELY REGARDED AS THE STANDARD FOR MEASURING THE U.S. STOCK MARKET PERFORMANCE. INVESTMENT IN EQUITIES INVOLVES MORE RISK THAN OTHER SECURITIES AND MAY HAVE THE POTENTIAL FOR HIGHER RETURNS AND GREATER LOSSES. BONDS HAVE INTEREST RATE RISK AND CREDIT RISK. AS INTEREST RATES RISE, EXISTING BOND PRICES FALL AND CAN CAUSE THE VALUE OF AN INVESTMENT TO DECLINE. CHANGES IN INTEREST RATES GENERALLY HAVE A GREATER EFFECT ON BONDS WITH LONGER MATURITIES THAN ON THOSE WITH SHORTER MATURITIES. CREDIT RISK REFERES TO THE POSSIBLITY THAT THE ISSUER OF THE BOND WILL NOT BE ABLE TO MAKE PRINCIPAL AND/OR INTEREST PAYMENTS.
THE INFORMATION CONTAINED HEREIN HAS BEEN PREPARED TO ASSIST INTERESTED PARTIES IN MAKING THEIR OWN EVALUATION OF GFG CAPITAL AND DOES NOT PURPORT TO CONTAIN ALL OF THE INFORMATION THAT A PROSPECTIVE CLIENT MAY DESIRE. IN ALL CASES, INTERESTED PARTIES SHOULD CONDUCT THEIR OWN INVESTIGATION AND ANALYSIS OF GFG CAPITAL AND THE DATA SET FORTH IN THIS PRESENTATION. FOR A FULL DESCRIPTION OF GFG CAPITAL’S ADVISORY SERVICES AND FEES, PLEASE REFER TO OUR FORM ADV PART 2 DISCLOSURE BROCHURE AVAILABLE BY REQUEST OR AT THE FOLLOWING WEBSITE: HTTP://WWW.ADVISERINFO.SEC.GOV/.
ALL COMMUNICATIONS, INQUIRIES AND REQUESTS FOR INFORMATION RELATING TO THIS PRESENTATION SHOULD BE ADDRESSED TO GFG CAPITAL AT 305-810-6500.