

Do you remember that dress? You know, that white one with gold stripes? How about that soundbite that said Laurel? Maybe you’ve seen the optical illusion of the duck/rabbit? Sometimes it’s a bit tough to tell what’s really happening in front of your eyes in real time. It may not be until after the fact, that things seem obvious to us. We’ve recently spent time using hindsight bias to our advantage, in trying to determine how low the recent valuation on equity markets actually reached. But now, let’s try and determine in real time, are we in the midst of another bear market rally, or the beginning of a sustainable bullish trend for U.S. equities.
Graduation
Every bull market in history once started as just a rally. Typically, there might be a few rallies that begin and fail before the final attempt has the foundation and momentum to turn into a sustainable trend. It seems like, every step of the way, bull markets in their early stages are dismissed and even despised by the masses. We’ll take a look at sentiment in a minute, but let’s try and use hard data first, in our attempt to interpret this current environment.
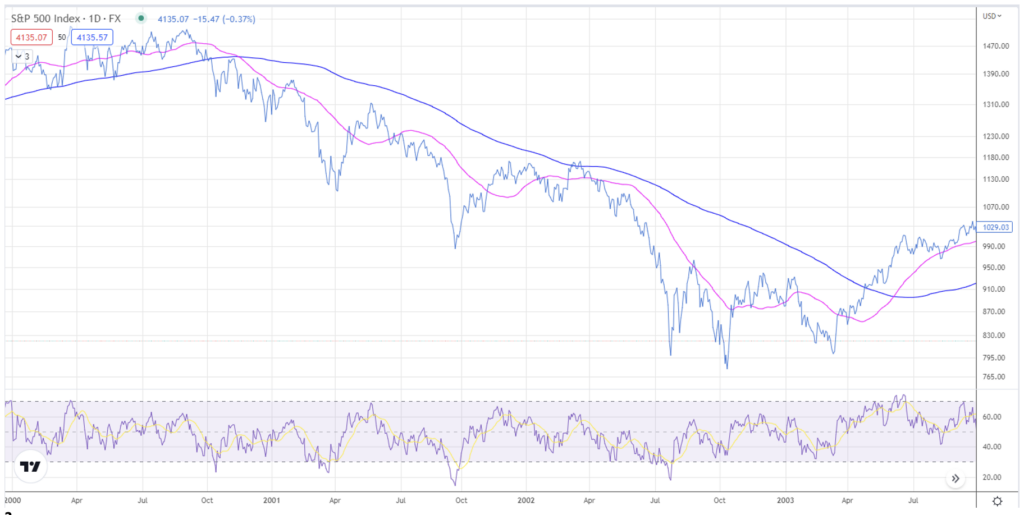
People have been quick to call for analogous periods when dissecting the bear market that began in January of 2022. We want to focus on the 2000-2003 bear market for a second. Largely because it’s the longest bear market in duration dating back to 1957 [1]. But also, because interestingly enough, there was only 1 bear market rally during the Great Financial Crisis (GFC) that hit the 20% mark, and none in the 1980 or 1973 bear markets. The chart below shows the price action of the S&P 500 along with its 50 (pink line) and 200 (dark blue line) day moving averages for the period:
[1] Peak to trough 929 trading days.
[2] Chart provided by TradingView.
It took 189 trading days in early 2000 for the index to finally reach the -20% threshold, formally putting the market into bear market territory. But we want to focus on the rallies that ensued after we saw a 20% decline.
Bear market rallies are a normal feature of unhealthy markets. By definition, all but 1 bear market rallies fail in every bear market. What’s relatively unique to the 2000-2002 market drawdown was the number of rallies that saw the index bounce by at least 20% off the previous low. Surely, if you’re an investor hoping for a turnaround, a 20% move to the upside is likely to convince you that this is the one.
The Dot.com bubble provided 4 face ripping rallies of at least 20% that all ended up in a fresh low being set after the temporary move higher. Rough.
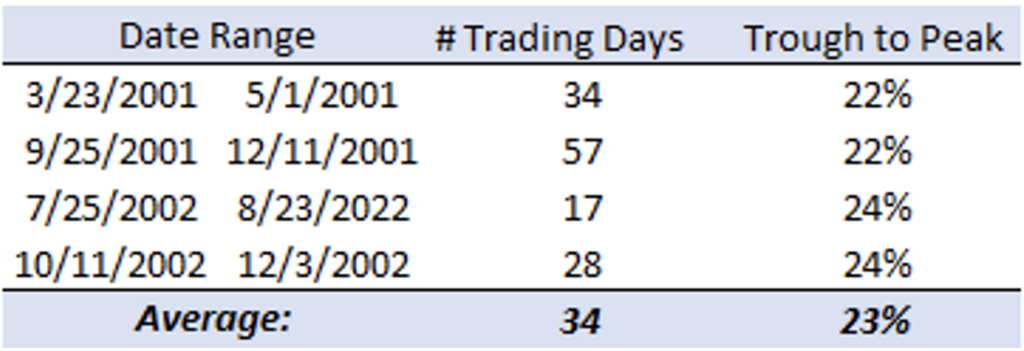
[3] Data provided by Bloomberg database. Table provided by GFG Capital
It wasn’t until the 5th rally of 20%, and nearly 3 years after the decent began, that the S&P 500 found itself in a rally that would eventually be the new bull trend. And using some basic technical analysis, there’s a few characteristics that the 4 failed rallies had in common, that the final move higher didn’t possess.
Here’s another look at the index, but now with each of the rallies noted [4]:

[4] Chart provided by TradingView
The first characteristic found across each of our four failed rallies above is the fact that the 50DMA did not cross above the 200DMA in any of the instances. Something known as a Golden Cross, one of the first signs investors look for when trying to confirm a bullish trend.
Second, in three of the four rallies the price of the index failed to breach the 200DMA. Another signal of a weak market environment. Equity returns when price is below its 200DMA tend to skew more negative, with a wider variance of realized returns. The same can be said for markets (or stocks) that are carrying a 50DMA below its respective 200DMA.
Finally, following each of the 4 failed rallies’ peak, a new low was set for the index; digging the wounds from the bear deeper than before.
It wouldn’t be hard to understand why an investor was pessimistic on the longevity of these rallies in real time. But the fifth and final 20% rally of the ‘00-’03 bear market managed to check all three of those boxes. In fact, 37 days after the final rally began (after setting a higher low for the cycle), and 22% later, the 50DMA crossed above the 200DMA. This sent a signal to the market that the trend had shifted from bearish to bullish.
So, how does this analogy compare to our current market environment? Similar to the GFC, we’ve only had 1 rally during this bear market reach the 20% threshold (the current one). Many investors have dismissed this rally- which began last October- as a pump fake. It seems like these investors often reference the four 20% rallies we’ve just discussed as well, as a cautionary tale.
However, they seem to leave out the fact that the rally we’ve seen off the lows in this cycle (set on 10/13/22) took nearly twice the average number of trading days to reach the 20% mark, than those four failed rallies. In fact, it was 78 days from trough to peak of the current market rally. Additionally, it took 69 days to eclipse the 200DMA, and 72 days of this rally for the S&P 500’s 50DMA to cross above its 200DMA. Three signals that investors might want to interpret as healthy accumulation. There are a few technical signals that the index has some resistance to break through before it convinces more investors that this move has been legit. But the lack of belief, actually supports the notion that this rally has been a healthy one.
Take a look at the recent trend of sentiment as measured by the AAII readings:
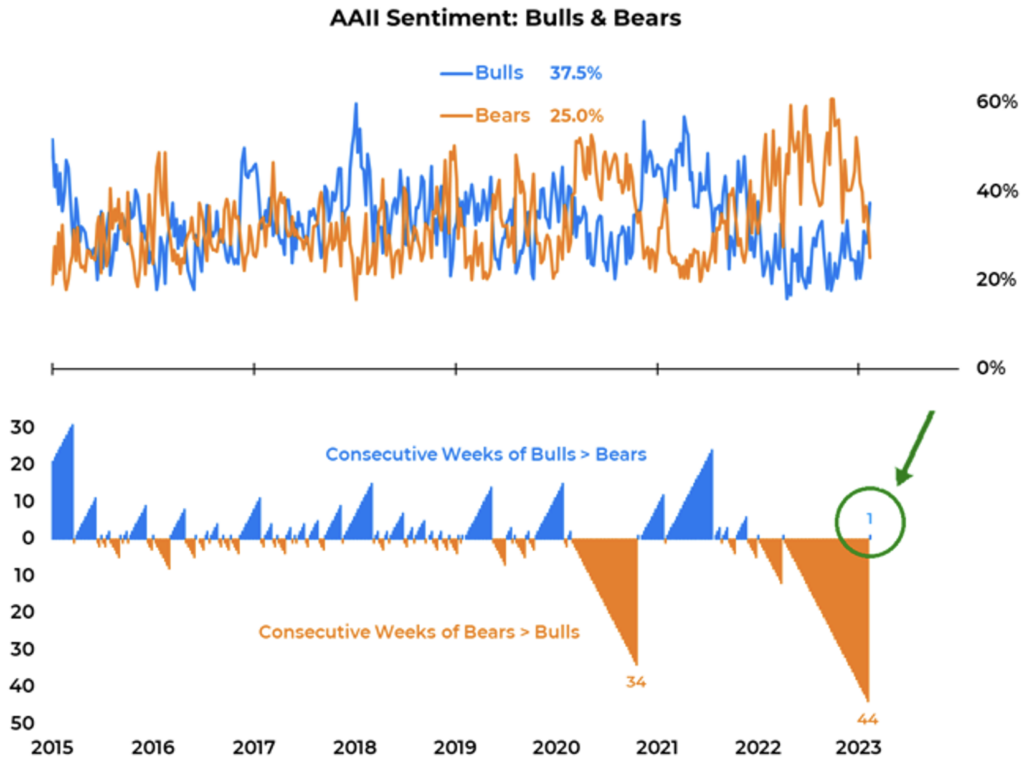
[5] Chart provided by JC Parets, data provided by American Association of Individual Investors (AAII).
And here’s the latest Bank of America Fund Manager Survey, polling professional money managers if they believe the move off the October lows is a bear market rally, or a new bullish trend:

[6] BofA Global Manager Survey as of 2/1/2023.
We’ve only barely begun to see signs of bullish sentiment come back to the market. Funny how sentiment follows price.
LEGAL STUFF
CURRENT MARKET DATA IS AS OF 2/16/2023. OPINIONS AND PREDICTIONS ARE AS OF 2/16/2023 AND ARE SUBJECT TO CHANGE AT ANY TIME BASED ON MARKET AND OTHER CONDITIONS. NO PREDICTIONS OR FORECASTS CAN BE GUARANTEED. INFORMATION CONTAINED HEREIN HAS BEEN OBTAINED FROM SOURCES BELIEVED TO BE RELIABLE BUT IS NOT GUARANTEED.
THIS MATERIAL DOES NOT CONSTITUTE A RECOMMENDATION TO BUY OR SELL ANY SPECIFIC SECURITY, PAST PERFORMANCE IS NOT INDICATIVE OF FUTURE RESULTS. INVESTING INVOLVES RISK, INCLUDING THE POSSIBLE LOSS OF A PRINCIPAL INVESTMENT.
THIS PRESENTATION (THE “PRESENTATION”) HAS BEEN PREPARED SOLELY FOR INFORMATION PURPOSES AND IS NOT INTENDED TO BE AN OFFER OR SOLICITATION AND IS BEING FURNISHED SOLELY FOR USE BY CLIENTS AND PROSPECTIVE CLIENTS IN CONSIDERING GFG CAPITAL, LLC (“GFG CAPITAL” OR THE “COMPANY”) AS THEIR INVESTMENT ADVISER. DO NOT USE THE FOREGOING AS THE SOLE BASIS OF INVESTMENT DECISIONS. ALL SOURCES DEEMED RELIABLE HOWEVER GFG CAPITAL ASSUMES NO RESPONSIBILITY FOR ANY INACCURACIES. THE OPINIONS CONTAINED HEREIN ARE NOT RECOMMENDATIONS.
INDEX PERFORMANCE IS PRESENTED FOR ILLUSTRATIVE PURPOSES ONLY. DIRECT INVESTMENT CANNOT BE MADE INTO AN INDEX. THE S&P 500 INDEX IS AN UNMANAGED INDEX, WHICH IS WIDELY REGARDED AS THE STANDARD FOR MEASURING THE U.S. STOCK MARKET PERFORMANCE. THE VIX INDEX IS BASED ON OPTIONS OF THE S&P 500 INDEX AND IS RECOGNIZED AS THE WORLD’S PREMIER GAUGE OF U.S. EQUITY MARKET VOLATILITY. INVESTMENT IN EQUITIES INVOLVES MORE RISK THAN OTHER SECURITIES AND MAY HAVE THE POTENTIAL FOR HIGHER RETURNS AND GREATER LOSSES. BONDS HAVE INTEREST RATE RISK AND CREDIT RISK. AS INTEREST RATES RISE, EXISTING BOND PRICES FALL AND CAN CAUSE THE VALUE OF AN INVESTMENT TO DECLINE. CHANGES IN INTEREST RATES GENERALLY HAVE A GREATER EFFECT ON BONDS WITH LONGER MATURITIES THAN ON THOSE WITH SHORTER MATURITIES. CREDIT RISK REFERES TO THE POSSIBLITY THAT THE ISSUER OF THE BOND WILL NOT BE ABLE TO MAKE PRINCIPAL AND/OR INTEREST PAYMENTS.
THE INFORMATION CONTAINED HEREIN HAS BEEN PREPARED TO ASSIST INTERESTED PARTIES IN MAKING THEIR OWN EVALUATION OF GFG CAPITAL AND DOES NOT PURPORT TO CONTAIN ALL OF THE INFORMATION THAT A PROSPECTIVE CLIENT MAY DESIRE. IN ALL CASES, INTERESTED PARTIES SHOULD CONDUCT THEIR OWN INVESTIGATION AND ANALYSIS OF GFG CAPITAL AND THE DATA SET FORTH IN THIS PRESENTATION. FOR A FULL DESCRIPTION OF GFG CAPITAL’S ADVISORY SERVICES AND FEES, PLEASE REFER TO OUR FORM ADV PART 2 DISCLOSURE BROCHURE AVAILABLE BY REQUEST OR AT THE FOLLOWING WEBSITE: HTTP://WWW.ADVISERINFO.SEC.GOV/.
ALL COMMUNICATIONS, INQUIRIES AND REQUESTS FOR INFORMATION RELATING TO THIS PRESENTATION SHOULD BE ADDRESSED TO GFG CAPITAL AT 305-810-6500.