

For the last twelve months, it wasn’t hard to find a market pundit expressing the disbelief of the estimates for U.S. corporate earnings (i.e., EPS estimates for the S&P 500) for the year 2023. Our team included. But the thing about bottom-up consensus earnings estimates, is that they’re slow to move. And when these estimates are slow to move, it means the reference point the majority of market participants use (Forward Price to Earnings) is also slow to adjust. Despite the bounty of data that we receive on a daily basis, sell side analysts typically don’t revise estimates lower without (what seems like) a greenlight to do so from management teams of the companies they’re covering. This dynamic led to a circular debate among investors last year, that has spilled over into the start of 2023: How high is 15 really?
Crystal Balls
The gripe many investors had, and still hold today, is that the estimates for earnings still are too rosy given everything we’ve seen at this stage in the cycle; coupled with what we’ve experienced in prior rate hike and business cycles. I think there’s some credence here. But we’re easily influenced creatures, and collectively I think we as humans have a tendency to anchor to past experiences as too strong of an indicator of what’s to come.
The core of the argument around earnings estimates boils down to one question investors are desperate to answer [1]: have we hit a low enough multiple on equities to say we’ve sufficiently priced in what’s to come?
If you’ll indulge us with a dash of hindsight bias, we think there’s another angle an investor can take to try and answer this question, before a wave of analysts confirm their priors for them. First, take a look at the trajectory of 2023 (and 2024) earnings estimates for the S&P 500:
[1] Or have someone answer for them, but that’s a separate conversation in itself regarding social proof bias.
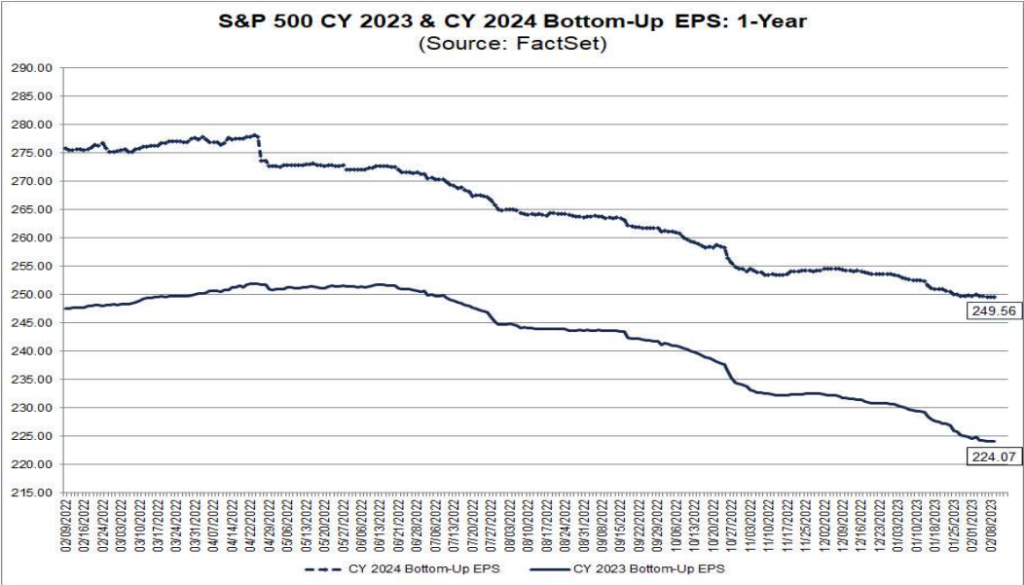
[2] Chart provided by FactSet, as of 2/10/23.
For reference, the 2022 final tally for earnings came has come in at just about 220 EPS [3]. As early as February of last year, there was a growing chorus of investors who were concerned we were either in, or immediately headed towards a recession. And therefore, the earnings estimates and forward P/E for the market couldn’t be relied on. Yet, it took almost the entire calendar year for these estimates to be lowered on a consensus basis.
At its low last year (10/13/22), the market carried a 14.9 forward P/E. It was even as low as 14.6 if you take the intraday-low from that day [4]. But since this multiple was using a consensus estimate that had been reduced from its peak by just 4%, the masses dismissed this well-below-average valuation on the stock market. The excuse was that the earnings estimates didn’t reflect a recession, and most recession environment markets bottom closer to 13-14x forward earnings.
Well today, we want to offer a ride in our DeLorean. With the benefit of a little hindsight bias, and roughly 90 trading days since the low in the S&P 500 last year, let’s revisit the idea of what the trough in multiple really was last October, and what individual investors could have been asking themselves at the time.
By the time October had rolled around, it was clear the U.S. economy was not in a recession, and perhaps further from one than where we might have thought we were at the start of the year. We’d just finished a third quarter that saw 3.2% growth in the economy, and the Atlanta Federal Reserve GDPNow tracker correctly forecasted positive GDP for Q4 [5]. Let alone the strength in the labor market at that time. But anchoring and adjustment bias wouldn’t allow for many investors to alter their initial perception on the environment. There’s an expression among traders that long-term investors would benefit from putting on a sticky note at their desk: “Trade the market you’re in, not the market that makes sense to you.”
If you were one of the market participants who dismissed the multiple at last year’s market low, what would you have needed to see if you weren’t married to your recessionary call? And why not deviate from the consensus if you believed that the earnings picture was too rosy?
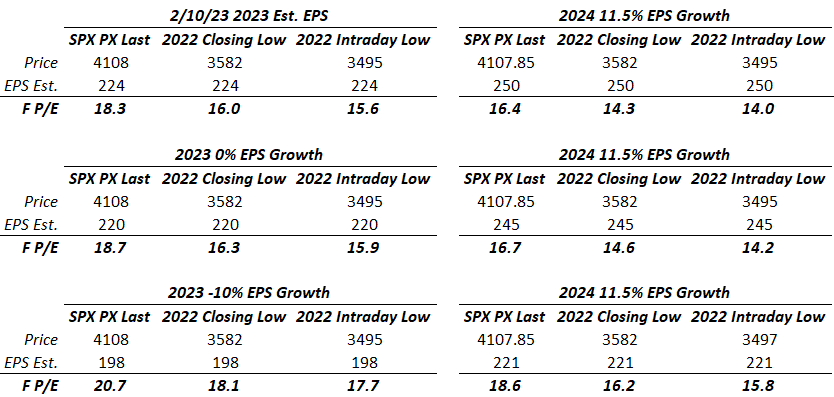
If you use today’s EPS estimates for 2023- which are roughly 10% off their peak from last summer and illustrate a mid-single-digit bottom line growth rate vs 2022- then last year’s trough multiple should’ve enticed, you. Take a look [6]:
[3] Data provided by FactSet, as of 2/10/23 69% of S&P 500 companies had reported 4Q ’22 earnings.
[4] Data provided by FactSet, Standard & Poor’s, as of 10/13/2022.
[5] Bureau of Economic Analysis
[6] Data provided by Bloomberg database, Factset. Table provided by GFG Capital.
Retrofitting asset valuations/multiples can prove to be a useful exercise for a few reasons. It allows us to retest our accuracy of assumptions, we can test the rigidness of our own tolerance (i.e., something is perceived to be “too expensive”), and it may allow us to reconsider how we analyze our environment in real-time and in the future.
If the economy weren’t in a recession, would so many investors dismiss a market carrying a forward multiple at 15.6x? What if you were told that a 15.6x multiple was 16% lower than the trailing 5-year average? Or even 9% lower than the 10-year average? Would you have begun to average into the market with dry power? Would the market “need” to retest levels that would reflect other recessionary norms in terms of forward multiples?
If you were to try and separate yourself from the pack a bit and assume the estimates last year were too high, and taken earnings growth down to 0% for 2023, then last October’s low would have brought your own forward P/E to 16.3x. Again, considerably below historical averages.
Climbing the Wall of Worry is part of every market cycle. Sometimes, there are a few walls we might have to climb on our way out of a bear market. Allowing ourselves to be flexible, and open to new information as it is presented to us perhaps is one of the best ways to defend ourselves from suffering from inertia.
Two quotes come to mind when I try to study investor behavior over the last year:
“The test of a first-rate intelligence is the ability to hold two opposing ideas in mind at the same time and still retain the ability to function.” – F. Scott Fitzgerald
And:
“No amount of sophistication is going to allay the fact that all of your knowledge is about the past and all your decisions are about the future.” – Ian H. Wilson.
Testing our own perceived beliefs of our environment is a tough task. But at the end of the day, if we can’t get comfortable questioning ourselves, then the loudest echo chamber any of us will ever be in, is in between our own two ears.
LEGAL STUFF
CURRENT MARKET DATA IS AS OF 2/14/2023. OPINIONS AND PREDICTIONS ARE AS OF 2/14/2023 AND ARE SUBJECT TO CHANGE AT ANY TIME BASED ON MARKET AND OTHER CONDITIONS. NO PREDICTIONS OR FORECASTS CAN BE GUARANTEED. INFORMATION CONTAINED HEREIN HAS BEEN OBTAINED FROM SOURCES BELIEVED TO BE RELIABLE BUT IS NOT GUARANTEED.
THIS MATERIAL DOES NOT CONSTITUTE A RECOMMENDATION TO BUY OR SELL ANY SPECIFIC SECURITY, PAST PERFORMANCE IS NOT INDICATIVE OF FUTURE RESULTS. INVESTING INVOLVES RISK, INCLUDING THE POSSIBLE LOSS OF A PRINCIPAL INVESTMENT.
THIS PRESENTATION HAS BEEN PREPARED SOLELY FOR INFORMATION PURPOSES AND IS NOT INTENDED TO BE AN OFFER OR SOLICITATION AND IS BEING FURNISHED SOLELY FOR USE BY CLIENTS AND PROSPECTIVE CLIENTS IN CONSIDERING GFG CAPITAL, LLC (“GFG CAPITAL”) AS THEIR INVESTMENT ADVISER. DO NOT USE THE FOREGOING AS THE SOLE BASIS OF INVESTMENT DECISIONS. ALL SOURCES DEEMED RELIABLE HOWEVER GFG CAPITAL ASSUMES NO RESPONSIBILITY FOR ANY INACCURACIES. THE OPINIONS CONTAINED HEREIN ARE NOT RECOMMENDATIONS.
INDEX PERFORMANCE IS PRESENTED FOR ILLUSTRATIVE PURPOSES ONLY. DIRECT INVESTMENT CANNOT BE MADE INTO AN INDEX. THE S&P 500 INDEX IS AN UNMANAGED INDEX, WHICH IS WIDELY REGARDED AS THE STANDARD FOR MEASURING THE U.S. STOCK MARKET PERFORMANCE. THE VIX INDEX IS BASED ON OPTIONS OF THE S&P 500 INDEX AND IS RECOGNIZED AS THE WORLD’S PREMIER GAUGE OF U.S. EQUITY MARKET VOLATILITY. INVESTMENT IN EQUITIES INVOLVES MORE RISK THAN OTHER SECURITIES AND MAY HAVE THE POTENTIAL FOR HIGHER RETURNS AND GREATER LOSSES. BONDS HAVE INTEREST RATE RISK AND CREDIT RISK. AS INTEREST RATES RISE, EXISTING BOND PRICES FALL AND CAN CAUSE THE VALUE OF AN INVESTMENT TO DECLINE. CHANGES IN INTEREST RATES GENERALLY HAVE A GREATER EFFECT ON BONDS WITH LONGER MATURITIES THAN ON THOSE WITH SHORTER MATURITIES. CREDIT RISK REFERS TO THE POSSIBILITY THAT THE ISSUER OF THE BOND WILL NOT BE ABLE TO MAKE PRINCIPAL AND/OR INTEREST PAYMENTS.
THE INFORMATION CONTAINED HEREIN HAS BEEN PREPARED TO ASSIST INTERESTED PARTIES IN MAKING THEIR OWN EVALUATION OF GFG CAPITAL AND DOES NOT PURPORT TO CONTAIN ALL OF THE INFORMATION THAT A PROSPECTIVE CLIENT MAY DESIRE. IN ALL CASES, INTERESTED PARTIES SHOULD CONDUCT THEIR OWN INVESTIGATION AND ANALYSIS OF GFG CAPITAL AND THE DATA SET FORTH IN THIS PRESENTATION. FOR A FULL DESCRIPTION OF GFG CAPITAL’S ADVISORY SERVICES AND FEES, PLEASE REFER TO OUR FORM ADV PART 2 DISCLOSURE BROCHURE AVAILABLE BY REQUEST OR AT THE FOLLOWING WEBSITE: HTTP://WWW.ADVISERINFO.SEC.GOV/.
ALL COMMUNICATIONS, INQUIRIES AND REQUESTS FOR INFORMATION RELATING TO THIS PRESENTATION SHOULD BE ADDRESSED TO GFG CAPITAL AT 305-810-6500.