

Markets are old. Several hundred years’ worth of market history can be traced back to the Dutch East India Company trading shares of its company on what is identified as one of the first stock exchanges in the world in 1602 [1]. Antwerp Bourse in Belgium was a precursor to stock exchanges in the 16th century, where merchants would gather to conduct business. Knowing that we can count back more than 5 centuries of documented trading activity, generally speaking, you can say that markets have seen it all. Despite the age of capital markets, there are some reoccurring risks that predate even the earliest opening bell. Earlier this month, one of the oldest conflicts in mankind’s history reared its head, in what has turned out to be one of the most violent and dumfounding chapters in the Israeli – Arab relationship. A contested coexistence that dates to pre-historic timelines, there hasn’t been a shortage of boiling points, and some breaking points, in years past. However, in the post-World War II era, there’s a short list of events in this relationship that have grabbed the world’s attention, and even its fear, the way the events of October 7th have. Today, this terror attack is coming at a point where many questions for investors linger when it pertains to corporate earnings, global growth, and inflation. We recently discussed the core economic situation that investors are grappling with, but here we’d like to focus on how markets have responded to geopolitical conflicts, both inside and outside the Levant.
Major Events & Market Responses
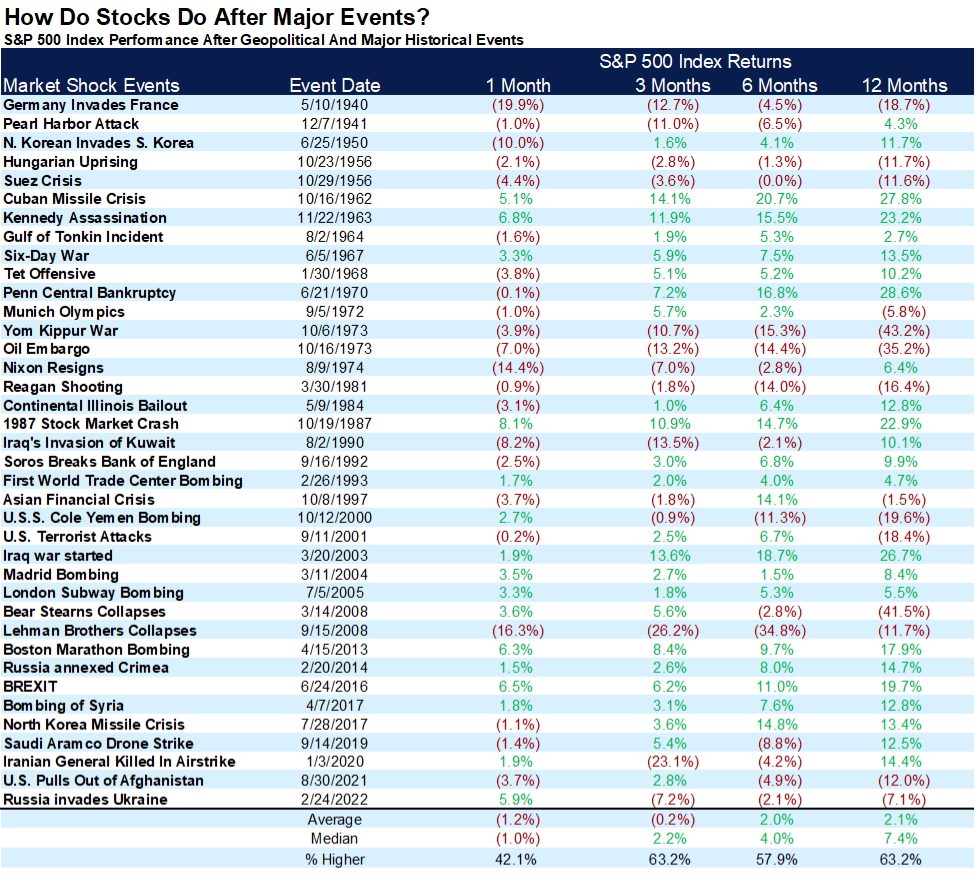
Unfortunately, the list of negative global events is a long one. Even if we bookend our view from 1940 through present day, we are able to collect a statistically significant number of events – and that’s with leaving plenty of regional conflicts off the list.
Taking a look at how U.S. equities have historically behaved following the date of an exogenous event, we can observe how markets have behaved shortly after. Historically, stocks tend to trend upward and to the right about ¾ of the time on an annual basis. You can see below that roughly 63% of the time, 12 months following one of the events highlighted below, the S&P 500 was higher by 7.4% on a median basis [2]. So, pretty close to normal behavior.
[1] Investopedia: https://www.investopedia.com/ask/answers/08/first-company-issue-stock-dutch-east-india.asp
[2] Data provided by Standard & Poors, FactSet.
[3] Chart provided by Carson Investments Research; data provided by FactSet. As of 10/9/2023.
We don’t think, however, investors should simply attribute these moves in stocks to the events that they followed. For example, take note of the event listed on 1/3/2020. The death of Qasem Soleimani at the time seemed like a significant provocation of Iran. They even swore harsh revenge. If you took the table above at face value, the way it is presented to investors, you’d think the immediate fallout was among the most extreme on this table. However, we all know the reality of what occurred in the three months following January 2020. Sometimes, the desire to measure everything creates more noise than substance.
I raise this point to bring attention early on in this discussion to understand that it is easy to overestimate the implications of a single event in a vacuum. Markets are a lot smarter than we occasionally forget to give them credit for [4]. Even when I raised the question if bond investors are truly the smart money recently, it’s done in a tongue-and-cheek manner. Markets might have knee-jerk responses over the course of a couple days (sometimes just hours), but as we stretch the time horizon, cooler heads tend to prevail – a trend we hope can continue both in and out of the market today, especially.
[4] Past performance is not indicative of future results. Market performance is not guaranteed. Investing involves risk, including the possible loss of your investment.
Markets In Wartime
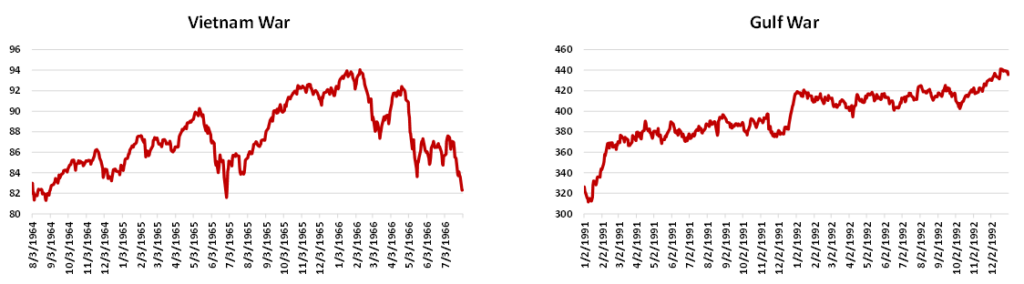
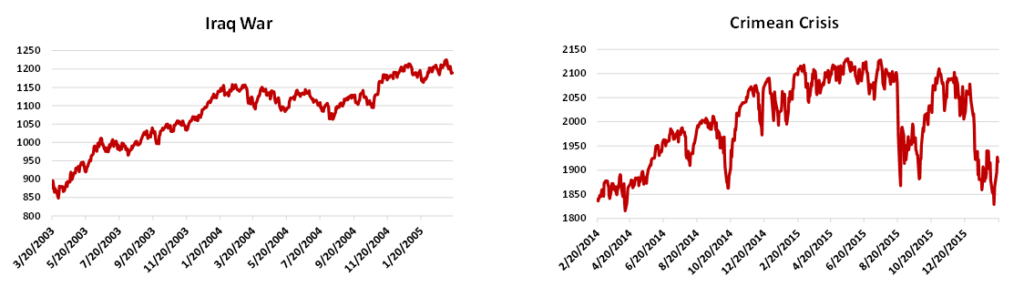
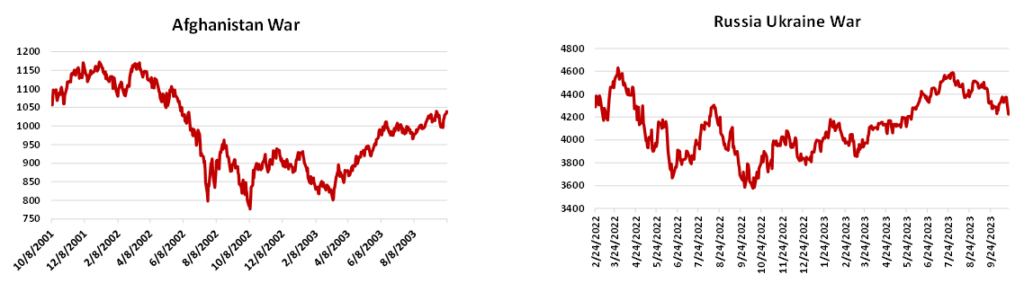
Let’s tighten our scope a few clicks, and hone in on market behavior following a wartime related event. Below we highlight the price behavior from the date of 6 conflicts, dating back to the U.S. involvement in the Vietnam War [5]:
[5] Data provided by Bloomberg database, charts generated by GFG Capital.
In each of the events shown above, the initial reaction within the U.S. stock market was lower in the following days and then moved higher than the pre-event price in the following weeks. The price movement shown above extends 24 months beyond the event in question (aside from the current Russia – Ukraine War). Each of these moments in time was only one piece of the ever-rotating Rubik’s Cube that is the global landscape. The staying power of these events, in terms of their influence, has proven to be a low on markets over the extended time horizon.
Like the January 2020 example in our first table, let’s highlight the Afghanistan War here. The U.S. occupied parts of Afghanistan for 20 years, only pulling out in questionable fashion in August of 2021. Were we supposed to attribute the market’s behavior for 20 years to the invasion of Afghanistan? Quagmires are a real, and reoccurring element of history and modern times (especially in Afghanistan, ask Russia or Rambo). This is part of the flaw in a single variable analysis. This event is yet another opportunity for investors to heed this lesson.
Israel – Arab Conflict Ripple Effects
The current events in Gaza and along the Israeli borders have many of us uttering the words “this time is different” for observations made both in and out of the market. Unfortunately, for many, there are elements here that feel far too familiar as well.
But if you’re an investor who believes that this crisis will, in fact, be a unique event in the long, tense history of these two groups, then you will likely claim there is an immediate threat to the price of oil. It’s a fair and logical dot to connect in response to the events since October 7th. I think before investors connect any dots with ink and immediately extrapolate the next sequence of events for the global economy, they need to let this chart be fully respected [6]:
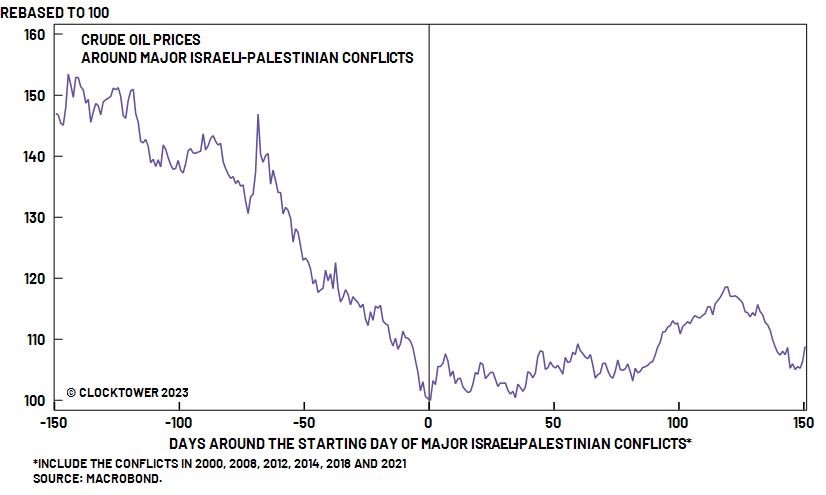
[6] Chart provided by Macrobond.
There has not been an event this century between Israel and Palestine that has led to a sustained, sharp move higher in oil. The average price for a barrel of oil has been less than 10% higher 150 days after the onset of a conflict between the two since the year 2000.
Looking at the Second Lebanon War in 2006 (not included above for obvious reasons), an investor would be able to make a similar takeaway [7]:
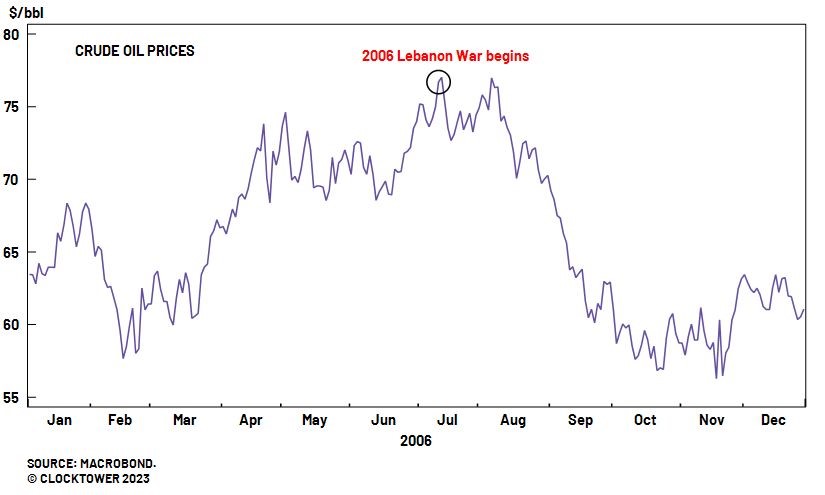
[7] Chart provided by Macrobond.
The Second Lebanon War, also known as the 2006 Lebanon War, was a conflict between Israel and Hezbollah, a terrorist organization based in Lebanon. This war began in July 2006 when Hezbollah militants conducted a cross-border raid into Israel and captured two Israeli soldiers. Israel responded with airstrikes and a ground incursion into southern Lebanon. The conflict lasted for about a month and resulted in significant casualties and damage on both sides. A ceasefire was brokered by the United Nations, and it led to the deployment of UN peacekeepers in southern Lebanon.
These are some very similar elements to what we’ve seen unfold over the last couple of weeks. The biggest question today that still lingers for all of us remains: how bad will this get before it gets better?
So far, the price of oil has climbed by ~7% since October 7th [8]. The apparent lynchpin to whether the price of oil moves meaningfully higher is Iran. In the months leading up to the attack, tensions were in a de-escalating trend between the U.S. and Iran. Iranian oil production has slowly crept higher over the last year (~0.5mb/d increase since August 2022), [9] but this trend could reverse course if Iran decides to up their defense of Hamas. If we do, in fact, see a hardline stance from the Iranian government, even without directly joining the conflict, the economic implications would be negative for the global economy. It’s unlikely we’d see Saudi Arabia meaningfully increase its production in order to fill the void left by Iran, which leaves the door open for oil breaking out above $100 per barrel.
However, if a cold war style involvement of third-party countries unfolds, and a meaningful economic impact were to be felt, it would be a rare occurrence relative to history.
[8] Data provided by Bloomberg database, as of 10/23/2023.
[9] Data provided by J.P. Morgan.
1948
What has been unfolding since the morning of October 7th is slowly shaping up to be a parallel to another notable moment in the history between Israel and their Arab neighbors: the 1948 Arab – Israeli War. This conflict began shortly after the State of Israel was established on May 14, 1948[10]. Israel’s neighboring Arab countries, including Egypt, Jordan, Syria, and Iraq, launched simultaneous attacks on the newly formed state. The war was a significant event in the 20th century and played a crucial role in the history of Israel and the broader Middle East. It had a profound impact on the region’s geopolitics and ongoing conflicts.
Throughout the course of the war in 1948 (November 1947 – July 1949), the U.S. stock market returned a non-annualized 11.39% [11]. As significant of an event that this conflict was to what is present day Israel, it’s again tough to assign the stock market’s response to solely this multinational conflict in the region.
Investors should remain mindful of the additional context that comes with this timeframe. We were less than three years removed from World War II, and the economy needed to transition from wartime to peacetime production and manufacturing. This helped contribute to a recession in 1945 and a second recession in 1949. Additionally, immediately following the Second World War, the Cold War between the U.S. and the Soviet Union began to unfold, increasing global tensions as well.
While we haven’t seen a direct conflict between the neighboring countries and Israel at this point, the rhetoric from these neighbors has been chilling. Perhaps what’s present today that wasn’t as prominent in 1948 is technology, specifically social media. It hasn’t taken an invasion from these nations, just the terror groups some of them harbor, for many of those with direct and indirect ties to Israel to feel a similar sensation of isolation. The global demonstrations supporting the attack by Hamas that have been displayed online, the dissemination of disinformation, along with the support and messages delivered by Iran have created the sensation of walls closing in for so many. If history is any guide to this situation, it should be anticipated that the cycle of provocation and tit-for-tat responses are destined to repeat. If your instinct is to wait for a calmer Middle East in order to invest in you and your family’s financial future, we’d advise rethinking that approach. We are believers that markets are likely to repeat their history when it comes to geopolitical events. And we’re particularly hopeful that many of the events outside of markets are never again repeated.
[10] U.S. Department of State.
[11] Data provided by Bloomberg database.
LEGAL STUFF
CURRENT MARKET DATA IS AS OF 10/23/2023. OPINIONS AND PREDICTIONS ARE AS OF 10/23/2023 AND ARE SUBJECT TO CHANGE AT ANY TIME BASED ON MARKET AND OTHER CONDITIONS. NO PREDICTIONS OR FORECASTS CAN BE GUARANTEED. INFORMATION CONTAINED HEREIN HAS BEEN OBTAINED FROM SOURCES BELIEVED TO BE RELIABLE BUT IS NOT GUARANTEED.
THIS PRESENTATION (THE “PRESENTATION”) HAS BEEN PREPARED SOLELY FOR INFORMATION PURPOSES AND IS NOT INTENDED TO BE AN OFFER OR SOLICITATION AND IS BEING FURNISHED SOLELY FOR USE BY CLIENTS AND PROSPECTIVE CLIENTS IN CONSIDERING GFG CAPITAL, LLC (“GFG CAPITAL” OR THE “COMPANY”) AS THEIR INVESTMENT ADVISER. DO NOT USE THE FOREGOING AS THE SOLE BASIS OF INVESTMENT DECISIONS. ALL SOURCES DEEMED RELIABLE HOWEVER GFG CAPITAL ASSUMES NO RESPONSIBILITY FOR ANY INACCURACIES. THE OPINIONS CONTAINED HEREIN ARE NOT RECOMMENDATIONS.
THIS MATERIAL DOES NOT CONSTITUTE A RECOMMENDATION TO BUY OR SELL ANY SPECIFIC SECURITY, PAST PERFORMANCE IS NOT INDICATIVE OF FUTURE RESULTS. INVESTING INVOLVES RISK, INCLUDING THE POSSIBLE LOSS OF A PRINCIPAL INVESTMENT.
INDEX PERFORMANCE IS PRESENTED FOR ILLUSTRATIVE PURPOSES ONLY. DIRECT INVESTMENT CANNOT BE MADE INTO AN INDEX. INVESTMENT IN EQUITIES INVOLVES MORE RISK THAN OTHER SECURITIES AND MAY HAVE THE POTENTIAL FOR HIGHER RETURNS AND GREATER LOSSES. BONDS HAVE INTEREST RATE RISK AND CREDIT RISK. AS INTEREST RATES RISE, EXISTING BOND PRICES FALL AND CAN CAUSE THE VALUE OF AN INVESTMENT TO DECLINE. CHANGES IN INTEREST RATES GENERALLY HAVE A GREATER EFFECT ON BONDS WITH LONGER MATURITIES THAN ON THOSE WITH SHORTER MATURITIES. CREDIT RISK REFERES TO THE POSSIBLITY THAT THE ISSUER OF THE BOND WILL NOT BE ABLE TO MAKE PRINCIPAL AND/OR INTEREST PAYMENTS.
THE INFORMATION CONTAINED HEREIN HAS BEEN PREPARED TO ASSIST INTERESTED PARTIES IN MAKING THEIR OWN EVALUATION OF GFG CAPITAL AND DOES NOT PURPORT TO CONTAIN ALL OF THE INFORMATION THAT A PROSPECTIVE CLIENT MAY DESIRE. IN ALL CASES, INTERESTED PARTIES SHOULD CONDUCT THEIR OWN INVESTIGATION AND ANALYSIS OF GFG CAPITAL AND THE DATA SET FORTH IN THIS PRESENTATION. FOR A FULL DESCRIPTION OF GFG CAPITAL’S ADVISORY SERVICES AND FEES, PLEASE REFER TO OUR FORM ADV PART 2 DISCLOSURE BROCHURE AVAILABLE BY REQUEST OR AT THE FOLLOWING WEBSITE: HTTP://WWW.ADVISERINFO.SEC.GOV/.
ALL COMMUNICATIONS, INQUIRIES AND REQUESTS FOR INFORMATION RELATING TO THIS PRESENTATION SHOULD BE ADDRESSED TO GFG CAPITAL AT 305-810-6500.