

Let’s talk about the wild financial ride we’ve been on lately. The third quarter could have made even the most seasoned investors question their life choices. Picture this: equity volatility reared its head, the stock market’s adrenaline junkie cousin, decided to throw a massive temper tantrum. It shot up, then crashed down, rinse and repeat. And as if that wasn’t enough, bond yields—those usually predictable, yawn-inducing things—decided to party like it was 1999. What’s more, for the previous three quarters, stocks were like overachieving students, returning at least 7% every 90 days [1]. But now, it’s as if they’ve decided to take a gap year and figure out their lives. Why the sudden change? Well, folks are getting a bit antsy about the possibility of a recession knocking at the door. It’s like waiting for the other shoe to drop, even though people have been shouting about it for almost two years. So, whether you’re reading this during a brief break from the relentless cycle of doom scrolling or in a quiet moment of reflection, let’s work together to make sense of this financial whirlwind and bring some much-needed context to the situation.
Smart Money
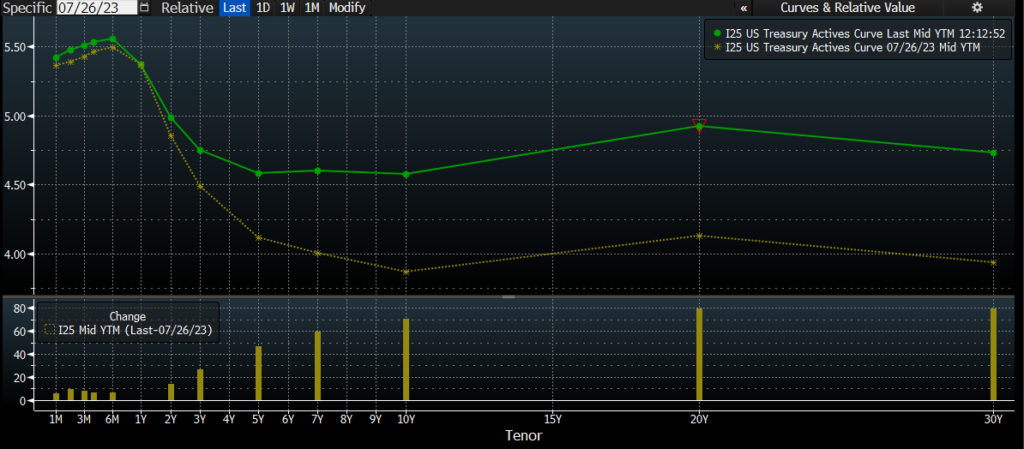
Let’s start with taking a good hard look at this chart of the yield curve. The green line is the curve as it was on October 11th. The yellow dotted line is the same curve, priced as of the last FOMC meeting where the Federal Reserve raised rates [2].
[1] Data provided by Bloomberg database.
[2] Chart provided by Bloomberg database. Previous FOMC meeting date 7/26/2023.
[3] Data provided by CME Group.
It’s important to note that there was no rate hike in the September meeting, and currently, the forward rate market is pricing in a 50% chance of a hike in the November or December meeting this quarter [3]. So, with no action taken by the Fed since July and minimal expectation for further hikes in this cycle, the rates on the 10, 20, and 30-year Treasury have increased by 60 and 80 basis points, respectively. That is….abnormal behavior, to say the least.
This brings me to my point: we’ve been told since the dawn of markets that bond investors are the smart money. Bond investors know their best-case scenario is receiving timely interest payments and, eventually, 100 cents on their dollar of principal. Fixed income markets, therefore, rightly focus on downside risks, either from inflation, credit, or manifold other uncertainties. The glass is always half-empty in this world. Respectfully, if they’re so superior, why has the long end of the curve only just now started to heed the word of the Fed? An 80 basis point increase in the 20 and 30-year spot on the curve in 2 months time, with no rate hikes on the front end, is unheard of.
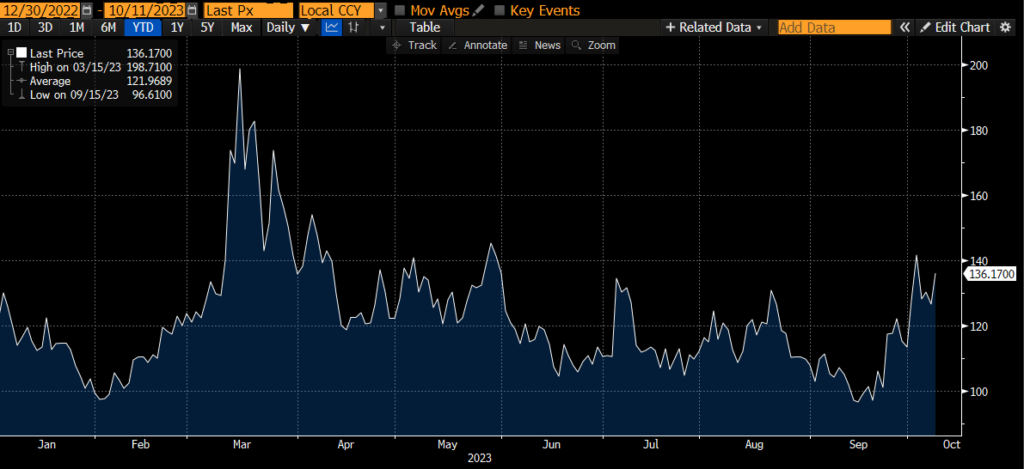
How unheard of exactly? Here’s a look at the expected volatility for the Treasury market as measured by the MOVE Index [4]:
[4] Chart provided by Bloomberg database.
We often times speak about the VIX when measuring stock anxiety and expectations for equity volatility. So, I will explain the recent bond volatility in equity terms.
Absent a catalyst, the MOVE Index has reached 140 in recent days. This reading on the index implies a 9 basis point move in yields every day for the following month. For comparison, this is the equivalent of the VIX reaching 50, which would imply a 3.1% move in stock prices every day for the following month. Or also known as a six standard deviation reading for the index.
No bank collapse this summer and no action from the Fed since July, but the long end of the curve seems to be throwing a tantrum. What gives?
To a large degree, the bond market has been very smart as it pertains to the front end of the curve front running where the Fed has been going over the course of this rate hike cycle. But the long end has needed to be dragged up to the levels (in the seemingly 11th hour) it has reached today, kicking and screaming the whole way.
Today, the curve is beginning to uninvert, which signals how off-base the long end of the curve has been. This can be interpreted as the long end of the curve has needed to adjust to the reality it has desperately tried to deny. Many investors are trying their hardest to guess why the move in rates has been so violent the last two months.
Here are two of the most common arguments made:
Debt crisis? This has long been the first thing that bond vigilantes tend to decry when there’s a bit of public attention paid to the U.S. debt – usually around the time of a Government shutdown showdown. The problem with this idea is that the Fed has been jawboning rates higher for almost two years, in an attempt to slow the economy. If rates were screaming higher while the Fed was trying to lower rates, then you’d have a better argument that the U.S. debt has become an immediate-term issue.
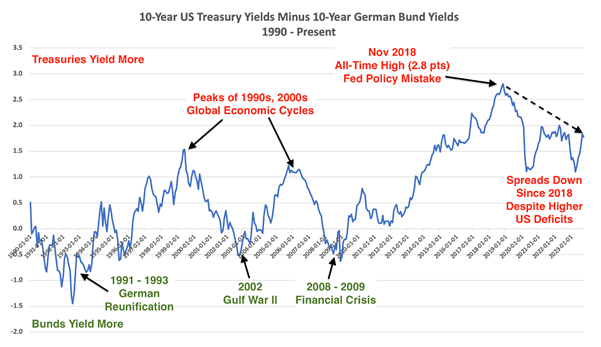
Here’s a bit more of an analytical view on the deficit point [5]:
[5] Chart provided by FRED, as of 9/30/2023.
Treasury – bund spreads are down, not up, since 2019 even though US budget deficits have increased materially. There is nothing in this data to suggest that markets are suddenly more wary of US Treasury debt because of rising budget deficits. Germany has the most pristine balance sheet of any developed economy and a strong historical bias against excessive spending. And yet, Treasury – bund spreads are lower right now than pre-Pandemic Era.
Issuance issue? If supply were outpacing demand for bonds so significantly that investors were shunning Treasuries, then why wouldn’t the move in rates coincide with the fiscal stimulus that carried us through the pandemic? Waiting for the closing act of a rate hike cycle to dump Treasuries is a very counterintuitive decision if this were the case.
While there are slants of truth to both of these arguments, it could just be that the economy is doing better than most of us expected it to be doing at this stage of the cycle (whatever stage this is called).
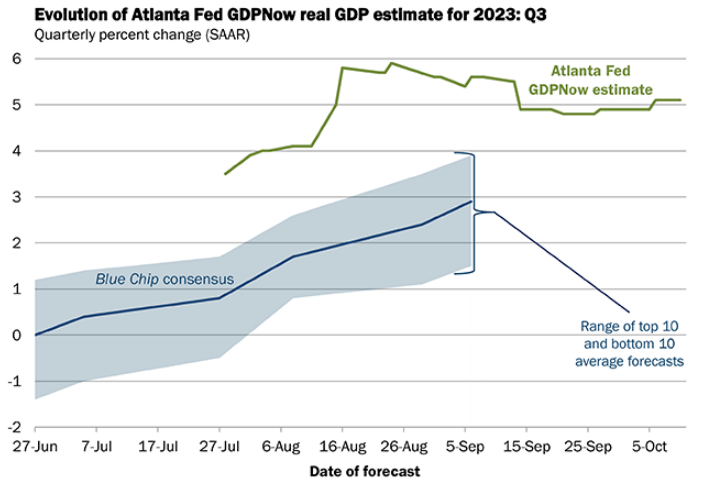
[6] Data and chart provided by Atlanta Federal Reserve.
The Atlanta Federal Reserve’s latest forecast for Q3 real GDP growth sits at 5.1% [6]. Growth expectations are what’s supposed to drive the long end of the curve. If these expectations need to be revised higher on a going-forward basis, then yields should reflect this inflection as well. The risk to this idealistic, fundamental explanation is what if the bond market is extrapolating too much of the recent history into the distant future? I guess then they’d be able to blame the Fed, which is America’s second favorite pastime after all.
Fourth Quarter Setup
There’s been a lot of rhetoric this year regarding narrow leadership. We’ve even seen new marketing terms adopted, like the “S&P 493” or the “Magnificent 7” to highlight the bifurcation in contribution to the S&P 500’s return this calendar year. But we adopted the mindset many moons ago that one index isn’t the entire market, and solely viewing market cap-weighted indices as an exercise to analyze overall market health and behavior is a flawed view of the global capital markets.
For example, we can view the entire New York Stock Exchange as a composite (which reflects 2,500 publicly listed companies). Looking at just the NYSE, you can see 964 stocks that are up over 10% this year, 561 stocks that are up over 20% this year, 148 stocks are up 50% this year, and 35 stocks doubled. The NYSE Composite has returned 3% through October 11th this year [7]. Where are people getting that it’s only 7 stocks that are going up? Headlines, I suppose.
So, what’s been the catalyst? And perhaps more importantly, what’s going to get stocks going again, resuming this bull market that began in summer 2022? It was always the Dollar. Currencies are the lifeblood of global investment and commercial activity. When non-dollar currencies appreciate, you know investors are bullish on global growth. When the greenback is rallying, you know markets see risks to the worldwide economic outlook. History shows that the value of the dollar is the single best indicator of major turning points, but these happen only infrequently. That has always been the catalyst. More recently, the new 52-week highs list peaked in July on the exact day that the US Dollar bottomed. So what’s it going to take to get stocks going again? A weaker Dollar, just like last Fall [8].

[7] Data provided by Bloomberg database.
[8] Chart provided by AllStar Charts.
If you start to see the US Dollar Index back below 105-105.50 or so, back below the early 2023 highs, then your short squeeze in stocks is on. We don’t want to over-simplify things. We just generally believe it is, in fact, that simple.
Adding fuel to the potential equity buying fire would be systematic trading needing to build back up equity long positions. Commodity Trading Advisor (CTA) funds (or hedge fund that uses a managed futures strategy across a multitude of asset classes) have found themselves the most underweight equities on record [9]:
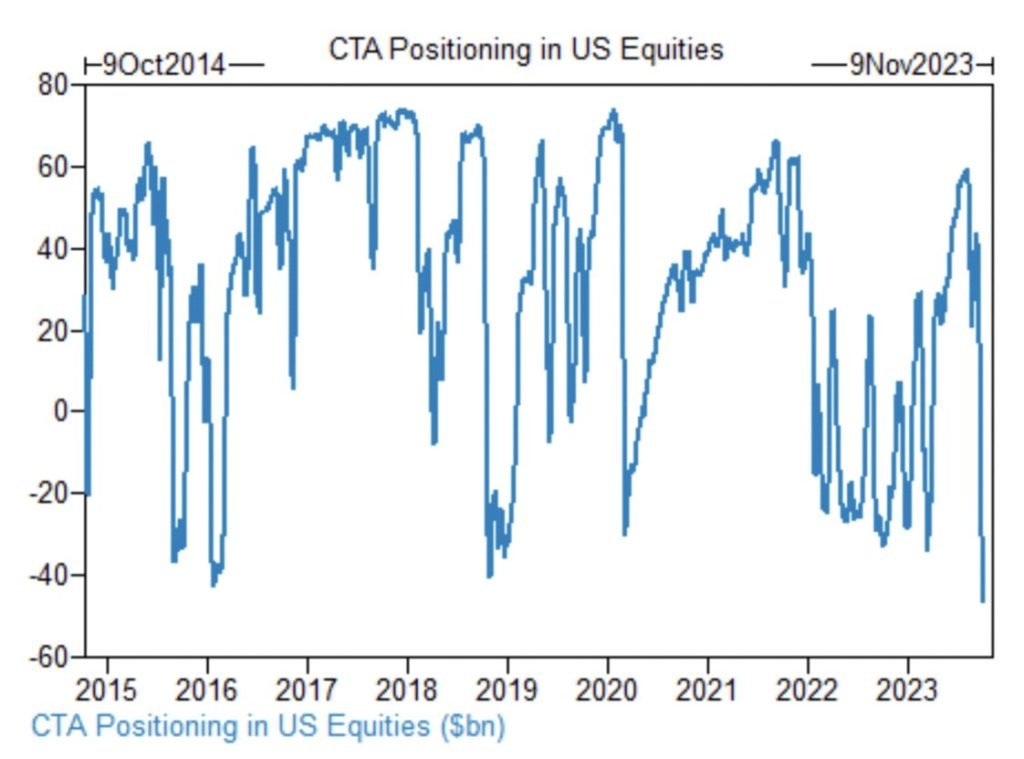
[9] Chart provided by Goldman Sachs.
Higher for Longer
If the bond market is right in its recent pivot, and the Fed is speaking the truth when it comes to its belief that a restrictive reference rate for an extended period is necessary, then investors need to be ready for an environment of higher rates (than what the last 10 years gave us) for longer.
Investors should learn the mantra that “yield is destiny” when investing in bonds. An estimate of what to expect is straightforward when you realize this. With a 10-year yield touching 4.8% at the start of the fourth quarter, and the U.S. Aggregate Bond Index carrying a Yield to Maturity of 5.41%, the forward returns for each of these exposures have a correlation of .91 and .85 respectively [10].
What about stocks? Well, before we start the discussion on equities, let’s contextualize today’s interest rate environment. Since 1958, the nominal rate on the 10-year Treasury has been 5.7%. Throughout the 1990’s, the yield averaged about 5.2%. Real rates since 1958 have averaged 2%. So, today’s rate environment is firmly in the range of what long-term averages have been for bonds [11]. Of course, we all know yields had moved lower for about four decades up until 2020.
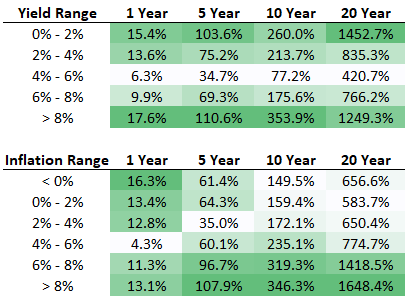
Now let’s take a look at how stocks have fared dating back to 1926 when yields and inflation have fallen into various brackets [12]:
[10] Data provided by J.P. Morgan.
[11] Data provided by Bloomberg database.
[12] Data provided by Bloomberg database. Chart provided by Ben Carlson.
[13] Data provided by Bloomberg database.
Going back to 1926, the forward returns for the S&P 500 have been the greatest when your starting point is very high or very low interest rates and inflation. The low rate and inflation environment isn’t that surprising to see rank so highly, but the highest rate and inflation environments ranking in the top two might be surprising for some. This is largely explained by the fact that we’ve only had a couple of instances in history where inflation and rates have been extraordinarily high. And in these instances, stocks ripped in the following years as rates and inflation fell.
Last year, inflation peaked in June at about 9% for headline CPI. In the following twelve months, the S&P 500 returned 19.56% [13].
In the world of financial markets, we stand at a pivotal juncture. Exploring the nuances of the yield curve’s bear steepener move, the standoff between the dollar’s rediscovered strength and the rally in equities, and dissecting the intricate dance of stock valuations in the face of rising interest rates, we are left with a tapestry of questions. Markets are a playground of complexity, a reflection of human behavior in its most intricate form. As we embrace this ambiguity, let us remember that it is within these uncertainties that we often stumble upon the most profound insights. Stay curious and keep pondering.
LEGAL STUFF
CURRENT MARKET DATA IS AS OF 10/09/2023. OPINIONS AND PREDICTIONS ARE AS OF 10/09/2023 AND ARE SUBJECT TO CHANGE AT ANY TIME BASED ON MARKET AND OTHER CONDITIONS. NO PREDICTIONS OR FORECASTS CAN BE GUARANTEED. INFORMATION CONTAINED HEREIN HAS BEEN OBTAINED FROM SOURCES BELIEVED TO BE RELIABLE BUT IS NOT GUARANTEED.
THIS PRESENTATION (THE “PRESENTATION”) HAS BEEN PREPARED SOLELY FOR INFORMATION PURPOSES AND IS NOT INTENDED TO BE AN OFFER OR SOLICITATION AND IS BEING FURNISHED SOLELY FOR USE BY CLIENTS AND PROSPECTIVE CLIENTS IN CONSIDERING GFG CAPITAL, LLC (“GFG CAPITAL” OR THE “COMPANY”) AS THEIR INVESTMENT ADVISER. DO NOT USE THE FOREGOING AS THE SOLE BASIS OF INVESTMENT DECISIONS. ALL SOURCES DEEMED RELIABLE HOWEVER GFG CAPITAL ASSUMES NO RESPONSIBILITY FOR ANY INACCURACIES. THE OPINIONS CONTAINED HEREIN ARE NOT RECOMMENDATIONS.
THIS MATERIAL DOES NOT CONSTITUTE A RECOMMENDATION TO BUY OR SELL ANY SPECIFIC SECURITY, PAST PERFORMANCE IS NOT INDICATIVE OF FUTURE RESULTS. INVESTING INVOLVES RISK, INCLUDING THE POSSIBLE LOSS OF A PRINCIPAL INVESTMENT.
INDEX PERFORMANCE IS PRESENTED FOR ILLUSTRATIVE PURPOSES ONLY. DIRECT INVESTMENT CANNOT BE MADE INTO AN INDEX. THE S&P 500 INDEX IS AN UNMANAGED INDEX, WHICH IS WIDELY REGARDED AS THE STANDARD FOR MEASURING THE U.S. STOCK MARKET PERFORMANCE. THE VIX INDEX IS BASED ON OPTIONS OF THE S&P 500 INDEX AND IS RECOGNIZED AS THE WORLD’S PREMIER GAUGE OF U.S. EQUITY MARKET VOLATILITY. INVESTMENT IN EQUITIES INVOLVES MORE RISK THAN OTHER SECURITIES AND MAY HAVE THE POTENTIAL FOR HIGHER RETURNS AND GREATER LOSSES. THE MOVE INDEX, OR MERRILL LYNCH OPTION VOLATILITY ESTIMATE INDEX, MEASURES THE IMPLIED VOLATILITY OF U.S. TREASURY OPTIONS ACROSS VARIOUS MATURITIES AND IS A GAUGE OF INTEREST RATE VOLATILITY IN THE U.S. TREASURY MARKET. BONDS HAVE INTEREST RATE RISK AND CREDIT RISK. AS INTEREST RATES RISE, EXISTING BOND PRICES FALL AND CAN CAUSE THE VALUE OF AN INVESTMENT TO DECLINE. CHANGES IN INTEREST RATES GENERALLY HAVE A GREATER EFFECT ON BONDS WITH LONGER MATURITIES THAN ON THOSE WITH SHORTER MATURITIES. CREDIT RISK REFERES TO THE POSSIBILITY THAT THE ISSUER OF THE BOND WILL NOT BE ABLE TO MAKE PRINCIPAL AND/OR INTEREST PAYMENTS.
THE INFORMATION CONTAINED HEREIN HAS BEEN PREPARED TO ASSIST INTERESTED PARTIES IN MAKING THEIR OWN EVALUATION OF GFG CAPITAL AND DOES NOT PURPORT TO CONTAIN ALL OF THE INFORMATION THAT A PROSPECTIVE CLIENT MAY DESIRE. IN ALL CASES, INTERESTED PARTIES SHOULD CONDUCT THEIR OWN INVESTIGATION AND ANALYSIS OF GFG CAPITAL AND THE DATA SET FORTH IN THIS PRESENTATION. FOR A FULL DESCRIPTION OF GFG CAPITAL’S ADVISORY SERVICES AND FEES, PLEASE REFER TO OUR FORM ADV PART 2 DISCLOSURE BROCHURE AVAILABLE BY REQUEST OR AT THE FOLLOWING WEBSITE: HTTP://WWW.ADVISERINFO.SEC.GOV/.
ALL COMMUNICATIONS, INQUIRIES AND REQUESTS FOR INFORMATION RELATING TO THIS PRESENTATION SHOULD BE ADDRESSED TO GFG CAPITAL AT 305-810-6500.