

Life is all about balance. As we step into the fresh terrain of 2024, it’s worth taking a moment to reflect on the roller-coaster ride that was the financial landscape of the past couple of years. If 2022 taught us anything, it’s that even the most seasoned investors can feel the sting of unpredictability. It was, to put it mildly, a rough patch in the history books, leaving many portfolios in a state of flux. But here’s where the plot thickens. Cue 2023—the year that not only restored hope but also showcased the unpredictable, yet oddly symmetrical, nature of markets and life itself. Picture this: the S&P 500 surging by over 25%, the Nasdaq 100 boasting a staggering 55% return, and bonds confidently striding into positive territory.[1] A stark contrast from the somber tones of the previous year, wouldn’t you agree? What’s fascinating isn’t just the swing from doom and gloom to exuberance, but the subtle lesson it imparts. In a world not too long ago where volatility seemed to reign supreme, 2023 emerged as the calming balm. Equity markets found their equilibrium, and those ominous predictions of recession that echoed at the beginning of the year? Well, they might have been premature—or perhaps, just a touch misguided. Join me as we delve into the art of balance, not just in investing but in the grand theater of life itself. For in these patterns of chaos and resurgence, lies a fundamental truth: the scales tend to find their equilibrium.
The Good with The Bad
The trailing 24 month return for the S&P 500 at the end of 2023 was a robust 3.37% on a total return basis (1.68% annualized). This came in a 2 year window where the average annualized CPI was 4.91% [2]. A stretch of time with negative real equity returns that investors have not seen in more than 40 years. While some might chalk up the relatively flat nominal equity returns to normal equity volatility, finding yourself in a flat rolling 2-year return period is rarified air. In fact, less than 3% of rolling 24 month periods carry a return below 3%.[3]
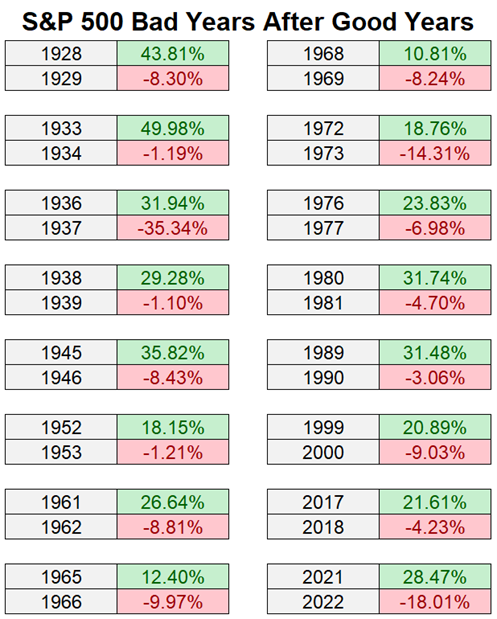
How do you manage to find yourself investing in such an environment? Well, the equity market shows you just how two faced it can be. It’s not common that we see a double digit gain in the stock market paired with a negative calendar year directly after it. But that’s actually exactly what occurred in 2021-2022.
[1] Data provided by Bloomberg database. As of 12/32/2023.
[2] Data provided by Bloomberg database. As of 12/32/2023.
[3] Data provided by Bloomberg database. As of 12/32/2023.
[4] Chart provided by Ben Carlson, Ritholtz.
So naturally, as we enter the new year following a mid-twenties return for the S&P 500 in 2023, investors are very quick to declare that we must be headed for another negative year for stocks. There’s an interesting quirk about our psychology as investors. We don’t seem to think that good times have staying power, but we are often times quick to extrapolate bad times into perpetuity. Perhaps this a residual of our loss aversion. It’s been widely covered since the release of Thinking Fast and Slow that people have a stronger negative response to losing $100 than we do to gaining $100. But there’s another anecdote that helps us understand just how tight of a grip negative experiences have on our heads and our hearts.
The 5:1 Ratio by psychologist John Gottman, who is known for his work on relationships, studied how much we must counteract the negative with positive in order to thrive. He found that for marriages to thrive, there needs to be a ratio of at least five positive interactions to counteract every one negative interaction.
Gottman conducted extensive research observing couples’ interactions and found that marriages with a higher ratio of positive to negative interactions tended to be more successful and enduring. Even if there were occasional disagreements or negative moments, a strong foundation of positive interactions helped maintain the relationship’s health and resilience.[5]
This concept translates well into the broader idea of the negativity bias. It shows that in relationships, as in life, negative experiences tend to hold more weight and require a greater number of positive experiences to counterbalance their impact.
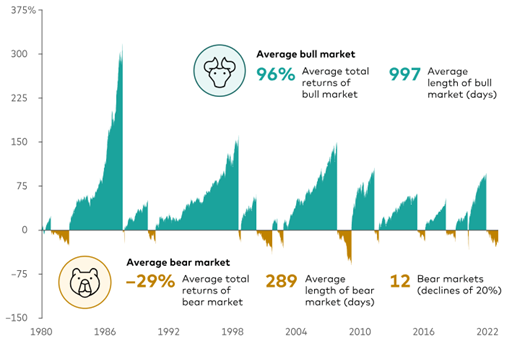
How has our relationship with the market faired under the scope of the 5:1 Ratio? Good times tend to occur more frequently, and last longer than the bad ones when it comes to the stock market:
[5] John Gottman, “The Seven Principles for Making Marriage Work” 1999.
[6] Chart provided by Vanguard. Data represents S&P 500 from 1/1/1980 through 12/31/2023.
[7] Data provided by Bloomberg database.
You see? The thing about stocks is they tend to not show how extreme the return profile can be, all the time. They’re more likely to carry extended periods of positive, and very rewarding returns for investors (who are patient enough to receive them). Since 1928, the S&P 500 has spent 40 percent of the time (40 total years, 16 separate clusters of at least 2 back-to-back years) in a stretch of consecutive and very strong calendar year returns. [7]
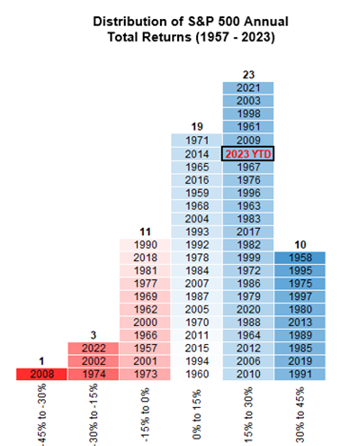
Investor tendencies to focus on the bad are particularly confusing when you see the distribution of annual returns in an illustration like the one below. Since 1957 there have been 15 years where the S&P 500 had a negative return. This compares to 52 years of positive returns, 33 of which were between 15-45%. I guess the 5:1 ratio is as powerful in markets as it is in relationships.
[7] Data provided by Bloomberg database.
[8] Chart provided by Sam Ro, TKer.
I Was Wrong
Three words that aren’t commonly uttered on Wall Street (and perhaps not in enough marriages). But with the rate of success that many Wall Street strategists have displayed over the years, or the accuracy that’s been displayed by economists and pundits, perhaps a New Year’s resolution for them will be to try using the phrase more often.
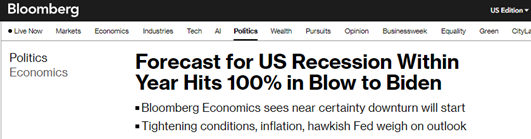
As a refresher here’s how confident economists were that we were going to end up in a recession before 2023 ended:[9]
[9] Bloomberg.com
[10] Data provided by Bloomberg database. 10/17/2022 – 10/17/2023.
That article was published in October 2022. Four days after the S&P 500 had bottomed out and went on to rally by 20% for the next 12 months. [10]
That article was published in October 2022. Four days after the S&P 500 had bottomed out and went on to rally by 20% for the next 12 months.
We’ve never been too shy to point out how futile we think trying to forecast the future is. Especially something as fickle as the price of an equity index. We aren’t against planning for the future, after all that’s what wealth management is at its core. But trying to predict the future is a game that is asymmetrically skewed to the downside.
Coming into 2022, the consensus Wall Street S&P 500 Price Target was a middle of the road call for a high single digit return (unsurprisingly close to the long-term average returns for stocks). The index went on to post a nearly -20% return for the year, as we all know. Coming into 2023, S&P 500 price target shot callers from 11 of the most widely tracked 18 institutions called for flat or negative returns for stocks.
These predictions are exceptionally tough to make. Which is probably why most years these calls are usually pointing towards long-term average returns with a dash of recency bias. This year?
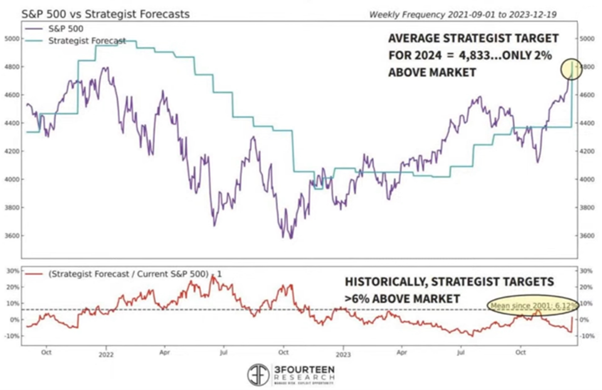
[11] chart provided by 3Fourteen Research.
There was a memo written in the Spring of 2001 by a Pentagon staffer named Linton Wells. By now it’s eerily famous, and we think investors should often check back with this memo when the deluge of predictions hit the headlines at the start of the new year.
The memo was part of a Quadrennial Defense Review in early 2001, and Lin Wells chronicled just how unpredictable the world was each decade that preceded the one that had just begun. The full memo is here, but the closer sums up the message nicely. Bear in mind, this was April of 2001:
“All of which is to say that I’m not sure what 2010 will look like, but I’m sure that it will be very little like we expect, so we should plan accordingly.”
A Non-Prediction Prediction for 2024
So instead of providing a prediction here for investors, we want to point out the prediction that we think is likely to prove to be most off the mark as we start 2024—rate cuts.
Here’s what the futures market for Fed Funds Rates are predicting: Markets put 83 percent odds on a 25-basis point rate cut by the March 20th, 2024, meeting, which is now less than 3 months away. Greater than 80 percent odds of another cut at the next meeting, on May 1st. And 89 percent odds of at least 5 cuts in 2024. [12]
Alright, so let’s break this down. Chair Powell and the FOMC find themselves in a classic conundrum. On one hand, they’re steering clear of revving the rate engine too hard, fearing it might throw the economy into a sudden recession. On the other hand, they’re tiptoeing around, not wanting to stoke any smoldering inflation fires by hitting the brakes prematurely.
Now, take a peek at those Fed Funds Futures—betting big on a rapid succession of rate cuts.
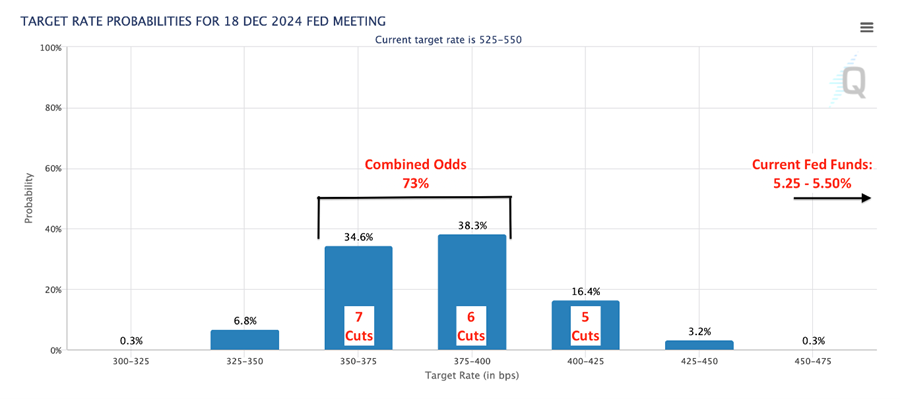
[12] CME Group Fed Watch Tool. Data as of 12/26/2023.
[13] Chart provided by CME Group.
But wait a minute! If the good ol’ US of A keeps its growth momentum, that might just be a hair trigger response. Yeah, we’re eyeing some rate cuts in the cards for 2024, but my bet is they’ll roll in later and slower than the market’s betting on.
To put it simply, strap in because it looks like the ride might not be as turbocharged as the market’s currently forecasting.
You might ask what makes our truth greater than theirs? Well, the Atlanta Fed’s GDPNow model printed a recent update for Q4 US GDP at 2.7%. The table below shows that it was better than expected Housing Starts which spurred the model to make this change. [14]
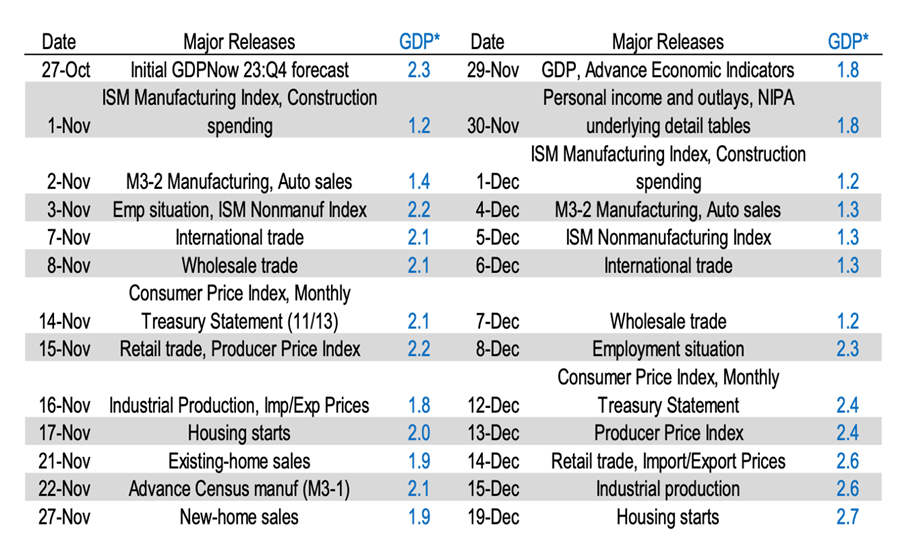
[14] Data provided by Atlanta Federal Reserve.
[15] Chart provided by Atlanta Federal Reserve.
There are some early signs that the US economy is reaccelerating as it moves through Q4. Should this continue, that momentum should carry over into 2024. This also throws some cold water on one of the market’s favorite trades in Q4 last year— long duration Treasuries.
It’s not impossible for the 10- and 30-year Treasury to provide equity like total returns in 2024. In fact, we are part of the bullish camp on Treasuries on the long end of the curve. But we also acknowledge absent an aggressively accommodating Fed, yields hovering at 4% typically are not associated with double digit returns for bonds. Of the 19 calendar years since 1928 that the 10-year Treasury has returned at least 10% on a total return basis, only 4 of those periods began with a yield of 4.5% or less. The most recent instance was 2020 where the beginning yield for the year was 1.92% [16].
Looking ahead, the buzz around an aggressive rate-cutting spree in 2024 might be akin to expecting fireworks without a match. Brace for surprises; the pace and timing might just throw everyone off their well-charted courses. As we navigate these uncertain waters, it’s not just about the numbers; it’s about the adaptability and the unforeseen turns that could redefine the game.
[16] Data provided by Bloomberg database.
LEGAL STUFF
CURRENT MARKET DATA IS AS OF 12/29/2023. OPINIONS AND PREDICTIONS ARE AS OF 12/29/2023 AND ARE SUBJECT TO CHANGE AT ANY TIME BASED ON MARKET AND OTHER CONDITIONS. NO PREDICTIONS OR FORECASTS CAN BE GUARANTEED. INFORMATION CONTAINED HEREIN HAS BEEN OBTAINED FROM SOURCES BELIEVED TO BE RELIABLE BUT IS NOT GUARANTEED.
THIS PRESENTATION (THE “PRESENTATION”) HAS BEEN PREPARED SOLELY FOR INFORMATION PURPOSES AND IS NOT INTENDED TO BE AN OFFER OR SOLICITATION AND IS BEING FURNISHED SOLELY FOR USE BY CLIENTS AND PROSPECTIVE CLIENTS IN CONSIDERING GFG CAPITAL, LLC (“GFG CAPITAL” OR THE “COMPANY”) AS THEIR INVESTMENT ADVISER. DO NOT USE THE FOREGOING AS THE SOLE BASIS OF INVESTMENT DECISIONS. ALL SOURCES DEEMED RELIABLE HOWEVER GFG CAPITAL ASSUMES NO RESPONSIBILITY FOR ANY INACCURACIES. THE OPINIONS CONTAINED HEREIN ARE NOT RECOMMENDATIONS.
THIS MATERIAL DOES NOT CONSTITUTE A RECOMMENDATION TO BUY OR SELL ANY SPECIFIC SECURITY, PAST PERFORMANCE IS NOT INDICATIVE OF FUTURE RESULTS. INVESTING INVOLVES RISK, INCLUDING THE POSSIBLE LOSS OF A PRINCIPAL INVESTMENT.
INDEX PERFORMANCE IS PRESENTED FOR ILLUSTRATIVE PURPOSES ONLY. DIRECT INVESTMENT CANNOT BE MADE INTO AN INDEX. INVESTMENT IN EQUITIES INVOLVES MORE RISK THAN OTHER SECURITIES AND MAY HAVE THE POTENTIAL FOR HIGHER RETURNS AND GREATER LOSSES. BONDS HAVE INTEREST RATE RISK AND CREDIT RISK. AS INTEREST RATES RISE, EXISTING BOND PRICES FALL AND CAN CAUSE THE VALUE OF AN INVESTMENT TO DECLINE. CHANGES IN INTEREST RATES GENERALLY HAVE A GREATER EFFECT ON BONDS WITH LONGER MATURITIES THAN ON THOSE WITH SHORTER MATURITIES. CREDIT RISK REFERES TO THE POSSIBLITY THAT THE ISSUER OF THE BOND WILL NOT BE ABLE TO MAKE PRINCIPAL AND/OR INTEREST PAYMENTS.
THE INFORMATION CONTAINED HEREIN HAS BEEN PREPARED TO ASSIST INTERESTED PARTIES IN MAKING THEIR OWN EVALUATION OF GFG CAPITAL AND DOES NOT PURPORT TO CONTAIN ALL OF THE INFORMATION THAT A PROSPECTIVE CLIENT MAY DESIRE. IN ALL CASES, INTERESTED PARTIES SHOULD CONDUCT THEIR OWN INVESTIGATION AND ANALYSIS OF GFG CAPITAL AND THE DATA SET FORTH IN THIS PRESENTATION. FOR A FULL DESCRIPTION OF GFG CAPITAL’S ADVISORY SERVICES AND FEES, PLEASE REFER TO OUR FORM ADV PART 2 DISCLOSURE BROCHURE AVAILABLE BY REQUEST OR AT THE FOLLOWING WEBSITE: HTTP://WWW.ADVISERINFO.SEC.GOV/.
ALL COMMUNICATIONS, INQUIRIES AND REQUESTS FOR INFORMATION RELATING TO THIS PRESENTATION SHOULD BE ADDRESSED TO GFG CAPITAL AT 305-810-6500.