

It’s no secret that inflation was the center of the conversation for the last 12 months. Last year, the S&P 500 saw a median daily price movement of 96 basis points on an absolute value basis. On the 12 days that we received a CPI report, the market’s median absolute value move was 172 basis points. Both the single best and worst days of the year for the index happened to occur on a day when we received an inflation report (9/13/22 -4.32%, 11/10/22 +5.55%). A similar trend can be observed when you analyze the VIX for the 2022 calendar year. The median absolute value move for the VIX last year was 395 basis points. On CPI days? We saw a median move of 660 basis points for the volatility index [1]. And even today, the eggconomy has taken the financial community by storm, seemingly extending the dominance that inflation is set to hold on our attention, the news cycle, and market price action. But at the tail end of the year, an interesting development began. The market started to show signs of apathy towards the biggest market-moving variable we’d observed in recent history. It raises the question, who’s driving the market now?
Be Very Very Quiet
The VIX Index has been below 25 (the 2022 average reading) for 54 consecutive trading days- the longest stretch in +12 months [2]. For reference, the average reading of the VIX since its inception in the 90’s has been 20. After a year where we seemingly entered a high-vol regime, with a clear catalyst that seemed to fuel the flames of anxiety that swarmed the market; the last two months appear to have seen a 180 in market sentiment.
Here, take a look [3]:

[1] All data provided by Bloomberg database, as of 1/19/2023.
[2] Data provided by Bloomberg database, TradingView, as of 1/19/2023.
[3] Chart provided by FRED.
A reading below 20 on the VIX has been a characteristic commonly found in a market where there is a sense of calm, understanding, and predictability around the Federal Reserve and the direction of monetary policy. That wasn’t exactly the case last year. This sense of ambiguity around monetary policy was likely magnified due to the lack of accuracy we saw when it came to pundits predicting inflation prints.
Out of the 12 reports last year, the only reading that came in in-line with consensus expectations was December’s. Hopefully we can all agree that inflation is showing clear signs of headed in the disinflation and deflationary direction. If not, here’s the number of components within the CPI report that are registering deflationary readings [4]:
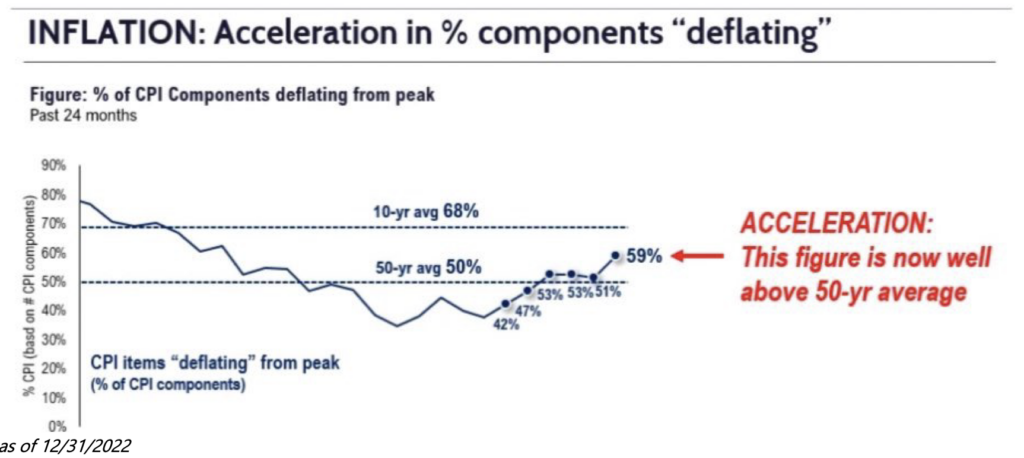
It might solely be a coincidence, but it seems a bit convenient that the “fear gauge” has appeared to rollover in the last couple of months; all while inflation data has come in cooler and estimates have grown more accurate on a month-to-month basis.
Here’s another data point to keep in mind [5]:

[4] Chart provided by Fundstrat, as of 12/31/2022.
[5] Chart provided by FRED.
Volatility in equity prices is largely stomached pretty well by investors. Volatility in bond prices is not so welcomed.
Last year one of the most volatile pockets of the market was the 2-Year Treasury. Often referred to as the “Shadow Fed Funds Rate” you can see in the chart above how unsettling it was for investors as the year played out to try and assess where monetary policy was headed, in real time. We began the year with a Fed estimate (and Street consensus) that 1 rate hike was in the cards by December 2022. Obviously, that’s not how things went down.
The vision for the Fed’s roadmap became a bit clearer as we approached the end of the year, and inflation data seemed to be consistently flashing disinflationary readings. And just like that, the 2-Year Treasury seemed to calm down, as did the VIX. The chart above seems to clearly deliver the message that the uncertainty surrounding inflation and the Fed were the driving forces of volatility for the last 12 months.
Today, with a fresh slate in front of us, it appears that the two biggest drivers of the VIX are not quite poised to disrupt investor gameplans the same way they did a year ago. So who’s behind the wheel with their foot hovering above the clutch, ready to push this 10 second car to the limit?
We’ve entered the cyclically bad period for earnings estimates. I don’t mean that earnings estimates are grim (yet). I mean that estimates have historically been inaccurate as the cycle begins to turn for the worst. This isn’t intended to be a shot at analysts. They’re largely forced to play the hands they’re dealt. Security analysts, also, are inherently an optimistic group. And post financial crisis, CEO and CFO guidance has grown increasingly short term in nature. Which means, we tend to see more “kitchen sink” guidance coming in the first quarter of the year, or a company’s respective annual report.
Here’s the current trend, for 2023 and 2024 estimates [6]:
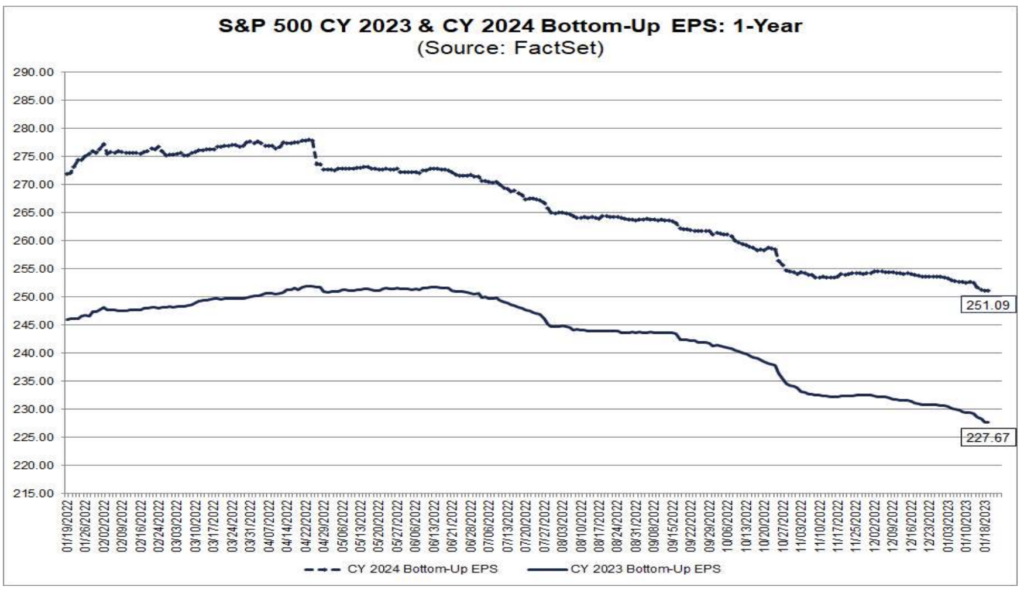
[6] Chart provided by Factset.
It wasn’t until October of last year that we began to see a more meaningful revision on a bottom-up basis for earnings this year. We spent the majority of the last year with just about half of market participants convinced we were in, or imminently headed to, a recession. But somehow, earnings estimates have yet to reflect the ‘hurricane’ on the horizon.
I’m not sure what the next catalyst will be for the VIX to potentially regain its 12-month moving average. Generally, VIX shocks are a product of the unexpected, and ambiguous variables that grab hold of investor attention. While it might seem obvious to some that earnings estimates are perhaps still too optimistic, it seems that many market indicators appear to be pricing in a better-than-expected ending to the saga that’s been this inflation wave and rate hike cycle. Time will tell.
LEGAL STUFF
CURRENT MARKET DATA IS AS OF 1/19/2023. OPINIONS AND PREDICTIONS ARE AS OF 1/19/2023 AND ARE SUBJECT TO CHANGE AT ANY TIME BASED ON MARKET AND OTHER CONDITIONS. NO PREDICTIONS OR FORECASTS CAN BE GUARANTEED. INFORMATION CONTAINED HEREIN HAS BEEN OBTAINED FROM SOURCES BELIEVED TO BE RELIABLE BUT IS NOT GUARANTEED.
THIS MATERIAL DOES NOT CONSTITUTE A RECOMMENDATION TO BUY OR SELL ANY SPECIFIC SECURITY, PAST PERFORMANCE IS NOT INDICATIVE OF FUTURE RESULTS. INVESTING INVOLVES RISK, INCLUDING THE POSSIBLE LOSS OF A PRINCIPAL INVESTMENT.
THIS PRESENTATION (THE “PRESENTATION”) HAS BEEN PREPARED SOLELY FOR INFORMATION PURPOSES AND IS NOT INTENDED TO BE AN OFFER OR SOLICITATION AND IS BEING FURNISHED SOLELY FOR USE BY CLIENTS AND PROSPECTIVE CLIENTS IN CONSIDERING GFG CAPITAL, LLC (“GFG CAPITAL” OR THE “COMPANY”) AS THEIR INVESTMENT ADVISER. DO NOT USE THE FOREGOING AS THE SOLE BASIS OF INVESTMENT DECISIONS. ALL SOURCES DEEMED RELIABLE HOWEVER GFG CAPITAL ASSUMES NO RESPONSIBILITY FOR ANY INACCURACIES. THE OPINIONS CONTAINED HEREIN ARE NOT RECOMMENDATIONS.
INDEX PERFORMANCE IS PRESENTED FOR ILLUSTRATIVE PURPOSES ONLY. DIRECT INVESTMENT CANNOT BE MADE INTO AN INDEX. THE S&P 500 INDEX IS AN UNMANAGED INDEX, WHICH IS WIDELY REGARDED AS THE STANDARD FOR MEASURING THE U.S. STOCK MARKET PERFORMANCE. THE VIX INDEX IS BASED ON OPTIONS OF THE S&P 500 INDEX AND IS RECOGNIZED AS THE WORLD’S PREMIER GAUGE OF U.S. EQUITY MARKET VOLATILITY. INVESTMENT IN EQUITIES INVOLVES MORE RISK THAN OTHER SECURITIES AND MAY HAVE THE POTENTIAL FOR HIGHER RETURNS AND GREATER LOSSES. BONDS HAVE INTEREST RATE RISK AND CREDIT RISK. AS INTEREST RATES RISE, EXISTING BOND PRICES FALL AND CAN CAUSE THE VALUE OF AN INVESTMENT TO DECLINE. CHANGES IN INTEREST RATES GENERALLY HAVE A GREATER EFFECT ON BONDS WITH LONGER MATURITIES THAN ON THOSE WITH SHORTER MATURITIES. CREDIT RISK REFERES TO THE POSSIBLITY THAT THE ISSUER OF THE BOND WILL NOT BE ABLE TO MAKE PRINCIPAL AND/OR INTEREST PAYMENTS.
THE INFORMATION CONTAINED HEREIN HAS BEEN PREPARED TO ASSIST INTERESTED PARTIES IN MAKING THEIR OWN EVALUATION OF GFG CAPITAL AND DOES NOT PURPORT TO CONTAIN ALL OF THE INFORMATION THAT A PROSPECTIVE CLIENT MAY DESIRE. IN ALL CASES, INTERESTED PARTIES SHOULD CONDUCT THEIR OWN INVESTIGATION AND ANALYSIS OF GFG CAPITAL AND THE DATA SET FORTH IN THIS PRESENTATION. FOR A FULL DESCRIPTION OF GFG CAPITAL’S ADVISORY SERVICES AND FEES, PLEASE REFER TO OUR FORM ADV PART 2 DISCLOSURE BROCHURE AVAILABLE BY REQUEST OR AT THE FOLLOWING WEBSITE: HTTP://WWW.ADVISERINFO.SEC.GOV/.
ALL COMMUNICATIONS, INQUIRIES AND REQUESTS FOR INFORMATION RELATING TO THIS PRESENTATION SHOULD BE ADDRESSED TO GFG CAPITAL AT 305-810-6500.