

So, the S&P 500 has kicked off 2024 with a solid 10% gain, following its impressive 26% surge in 2023. [1] Now, the big question looming is: How much more can we reasonably expect from US large caps for the rest of the year? Well, to find some clues, let’s take a trip down momentum memory lane.
[1] Data provided by Bloomberg database.
Momo
Since 1928 (excluding 2023), there have been 16 years when the S&P landed between a 20 and 30% return. This range nicely brackets last year’s 26% advance. Out of these instances, the S&P managed to keep the positive vibes going in the following year 10 times, while the other 6 years saw a bit of a downturn. The average gain for those victorious post-rally years was a solid 17.2%, while the losing years suffered an average total return loss of 8.0%. So, what’s the takeaway here? Well, history is giving us roughly two-thirds odds (that’s 63%, to be precise) for another winning year in 2024, with an average return expectation of 17% compared to the 10% year-to-date gain. [2]
But, as always, let’s not get too ahead of ourselves. It’s worth doing a quick review of the years where the follow-through fell short and what went awry. In 1939, despite a roaring 29.3% climb in 1938, the S&P 500 took a slight dip of 1.1% due to geopolitical uncertainty surrounding the onset of World War II. Then, in 1962, after a stellar 26.6% gain in 1961, the market took a tumble of 8.8%, known as the “Kennedy Slide.” [3]
Similarly, in 1977, after a robust 23.8% gain in 1976, the S&P 500 experienced a 7.0% decline as Treasury bond yields rose throughout the year, spurring concerns about inflation and Fed tightening. And who could forget the dot com bubble burst in 2000? Following a dazzling 20.9% gain in 1999, the S&P 500 took a 9.0% hit.
Chair Powell’s maneuverings in 2018 also made waves, as the S&P 500, after a strong 21.6% gain in 2017, stumbled by 4.2% due to concerns over interest rate hikes. And more recently, in 2022, after an impressive 28.5% climb in 2021, the Fed’s aggressive interest rate adjustments to tame pandemic-era inflation led to an 18.0% downturn.
So, what’s the bottom line here? Well, price momentum tends to be a formidable force in the markets, but it often takes a genuine shock to disrupt it. Geopolitics and rising interest rates have historically been the prime suspects. Nonetheless, despite Q1’s impressive returns, we’re still bullish on US large caps. While history provides cautionary tales, at present, we don’t see any of those catalysts brewing on the horizon for the rest of the year.
[2] Data provided by Bloomberg database.
[3] Data provided by Bloomberg database. Kennedy Slide
Stock Bond Correlations
A consistent theme over the last couple of years has been dollar strength leading to stock and bond weakness occurring simultanesouly. This weakness in both stocks and bonds has lead to elevated levels of volatility for both asset classes over this period.
But an interesting separation has been unfolding, where stocks have not responded as negatively to moves higher in USD or a more hawkish expectation from the interest rate market. The same can’t be said for bonds:

[4] Chart provided by DataTreck via Twitter. Data provided by FactSet.
When we look at the long-term trends, it’s fascinating how closely the price volatility of long-dated Treasuries mimics that of the S&P 500. Essentially, it means that the market is just as unsure about where +20-year Treasuries should trade as it is about the “fair value” price for the S&P 500.
Except for major crises like 2008 and 2020, Treasury and US large cap stock volatility tend to move almost hand in hand. While bonds usually have lower volatility than stocks, there are times when bond prices sway more than stocks, like in 2011, 2013, 2015, 2017, and 2021.
Recently, however, bond volatility has taken a surprising turn, surpassing stock volatility by an unprecedented margin since June 2023. This shift indicates that markets currently trust the predictability of private-sector earnings more than long-run Fed policy or US government budget deficits, despite the proven success of US large caps. This divergence also reflects skepticism surrounding the Federal Reserve’s economic forecasting abilities and the US government’s fiscal discipline. Furthermore, these periods of stock/Treasury volatility inversion typically occur in the middle of economic and market cycles, hinting at a mid-cycle market narrative, which tends to be bullish for stock prices.
2025 Rate Expectations
At the start of the year we voiced our skepticism with the market’s expectations for the timing, and velocity of interest rate cuts for the 2024. After the first quarter, it seems that the market has curbed its enthusiasm for this year. And yet, despite the market pricing 7-8 cuts down to 3 over the next 9 months, risk assets and the yield curve have remained surprisingly calm. Perhaps, considering Fed rate policy over the next 18 months unveils a broader perspective than just the year-end 2024 scenario. While debates still are swirling around whether the FOMC will opt for 2, 3, or 4 cuts this year, the real narrative lies in what this trajectory signals for monetary policy well into 2025 and beyond.
Delving into current rate market projections sheds light on various rate scenarios post the September 2025 FOMC meeting. In our revised graph, we juxtapose odds for potential outcomes at the December 2024 meeting, along with the requisite number of 25 basis point rate cuts for each scenario. Notably, we’ve highlighted in red the anticipated 2025 rate cuts through September, assuming the market (and FOMC) are aligned on three 25 basis point reductions this year.

[5] Chart provided by CME Fed Watch.
Market sentiment leans towards anticipating 3 rate cuts over the next 9 months, with an additional 2-3 in the subsequent 9 months of 2025. What’s crucial isn’t just the cuts this year, but the entire sequence of rate reductions that investors are fixated on. Should inflation persist stubbornly high, a reassessment of the expected steady rate cut regime over the next 18 months looms. Here, corporate profits will play a pivotal role in propelling equities forward.
Far from bearish, we view this as a point of optimism. The dynamic is clear: either we witness a slowing economy coupled with rate cuts or a robust economy yielding better earnings. This tension characterizes mid-cycle markets, and 2024–2025 appears to be no exception.
Earnings vs Rates
As the market continues to grapple with aligning their expectations with where they think the FOMC’s forecasts will end up, investors might be better off paying attention to a different variable. Instead, we should be asking ourselves would we rather be assured there were rate cuts this year or if corporate earnings were going to come in as robust as expected?
Inflation data this year has come in hotter than anticipated, coupled with robust labor market data like weekly Initial Claims. That’s making it tricky for the Fed to justify slashing rates anytime soon. Sure, both the FOMC and markets are eyeing three 25 basis point cuts this year, but unless inflation starts playing nice and heads towards the Fed’s 2% target, and pronto, that optimism might be a tad premature – even after reducing the expectations from 7 to 3 cuts for the year.
On the flip side, a beefier-than-expected US economy could grease the wheels for public companies to strut their stuff with stronger earnings growth. While the Street’s banking on a hefty 11% EPS bump for 2024 over 2023, continued economic expansion might reel in something more realistic, like a 5-8 % earnings boost.
Now, why are folks singularly focused on rate cuts? Well, they’re easier to wrap your head around than corporate earnings. Plus, lower rates mean less chance of a rough landing or, heaven forbid, a recession. And hey, if long-term rates follow the Fed’s lead, rate cuts could also shave off a chunk of the discount rate used to tally up the present value of future earnings. But let’s not kid ourselves—predicting corporate earnings growth is like trying to read tea leaves, even when the economy’s humming along. Just ask any analyst knee-deep in multistage DCF’s.
But here’s the kicker: We’d much rather see a slow and steady climb in earnings than a flurry of rate cuts.
Wall Street equity analysts have been raising their 2024 earnings estimates recently, but the way they get to their annual numbers is a case study in why we treat this data very cautiously. The annotations on the following chart of the current year quarterly earnings estimates show how much they have changed in the last 5 weeks:
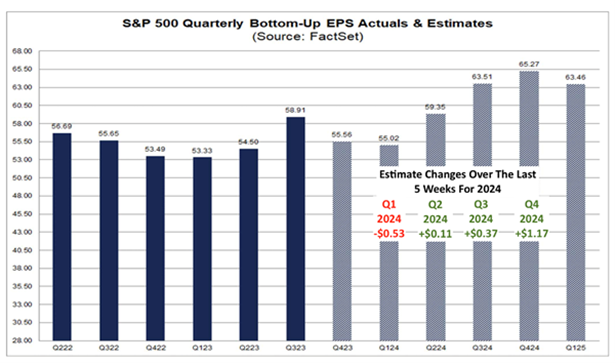
[6] Chart provided by FactSet.
Rather than reduce their Q2 – Q4 2024 numbers, analysts have simply pushed their once too aggressive Q1 expectations out through the balance of the year, taking their aggregate 2024 estimate even higher. Q2 and Q3 positive revisions (totaling $0.48/share) replace the cuts to Q1 ($0.53/share). More surprising – and likely unrealistic – Q4 estimates are up $1.17/share over the last 5 weeks. You could make the argument that the bump in expectations for the next three quarters is more of an attempt to justify the recent rally in hindsight.
Back to rates for a moment: Since 2019, S&P 500 earnings have shot up by a whopping 46% (assuming an 8% growth in 2024, not the Street’s pie-in-the-sky 11% estimate). Meanwhile, two-year Treasury yields, our litmus test for future Fed monetary policy, have gone from a measly 1.6% to a hearty 4.7% since late 2019. And ten-year yields? They’ve pulled a similar stunt, climbing from 1.9% in December 2019 to a beefy 4.3% today. Here’s the rub: Stocks have given two thumbs up to these sky-high Fed Funds rates since 2019, tracking almost hand-in-hand with corporate earnings power. And get this—even higher long-term rates haven’t ruffled equity valuations one bit. Now, that’s what I call remarkable but undeniably true.
Bottom line? Earnings growth reigns supreme when it comes to stock prices. Sure, a bit of Fed policy chatter might give markets the jitters, especially if Chair Powell and the FOMC start hinting at fewer rate cuts this year. But hey, that’s no reason to start panicking. A hawkish Fed pivot could be a sign that the US economy’s still got some mojo, setting the stage for a shiny uptick in corporate earnings come 2024 and 2025.
LEGAL STUFF
CURRENT MARKET DATA IS AS OF 3/31/2024. OPINIONS AND PREDICTIONS ARE AS OF 3/31/2024 AND ARE SUBJECT TO CHANGE AT ANY TIME BASED ON MARKET AND OTHER CONDITIONS. NO PREDICTIONS OR FORECASTS CAN BE GUARANTEED. INFORMATION CONTAINED HEREIN HAS BEEN OBTAINED FROM SOURCES BELIEVED TO BE RELIABLE BUT IS NOT GUARANTEED.
THIS PRESENTATION (THE “PRESENTATION”) HAS BEEN PREPARED SOLELY FOR INFORMATION PURPOSES AND IS NOT INTENDED TO BE AN OFFER OR SOLICITATION AND IS BEING FURNISHED SOLELY FOR USE BY CLIENTS AND PROSPECTIVE CLIENTS IN CONSIDERING GFG CAPITAL, LLC (“GFG CAPITAL” OR THE “COMPANY”) AS THEIR INVESTMENT ADVISER. DO NOT USE THE FOREGOING AS THE SOLE BASIS OF INVESTMENT DECISIONS. ALL SOURCES DEEMED RELIABLE HOWEVER GFG CAPITAL ASSUMES NO RESPONSIBILITY FOR ANY INACCURACIES. THE OPINIONS CONTAINED HEREIN ARE NOT RECOMMENDATIONS.
THIS MATERIAL DOES NOT CONSTITUTE A RECOMMENDATION TO BUY OR SELL ANY SPECIFIC SECURITY, PAST PERFORMANCE IS NOT INDICATIVE OF FUTURE RESULTS. INVESTING INVOLVES RISK, INCLUDING THE POSSIBLE LOSS OF A PRINCIPAL INVESTMENT.
INDEX PERFORMANCE IS PRESENTED FOR ILLUSTRATIVE PURPOSES ONLY. DIRECT INVESTMENT CANNOT BE MADE INTO AN INDEX. INVESTMENT IN EQUITIES INVOLVES MORE RISK THAN OTHER SECURITIES AND MAY HAVE THE POTENTIAL FOR HIGHER RETURNS AND GREATER LOSSES. BONDS HAVE INTEREST RATE RISK AND CREDIT RISK. AS INTEREST RATES RISE, EXISTING BOND PRICES FALL AND CAN CAUSE THE VALUE OF AN INVESTMENT TO DECLINE. CHANGES IN INTEREST RATES GENERALLY HAVE A GREATER EFFECT ON BONDS WITH LONGER MATURITIES THAN ON THOSE WITH SHORTER MATURITIES. CREDIT RISK REFERES TO THE POSSIBLITY THAT THE ISSUER OF THE BOND WILL NOT BE ABLE TO MAKE PRINCIPAL AND/OR INTEREST PAYMENTS.
THE INFORMATION CONTAINED HEREIN HAS BEEN PREPARED TO ASSIST INTERESTED PARTIES IN MAKING THEIR OWN EVALUATION OF GFG CAPITAL AND DOES NOT PURPORT TO CONTAIN ALL OF THE INFORMATION THAT A PROSPECTIVE CLIENT MAY DESIRE. IN ALL CASES, INTERESTED PARTIES SHOULD CONDUCT THEIR OWN INVESTIGATION AND ANALYSIS OF GFG CAPITAL AND THE DATA SET FORTH IN THIS PRESENTATION. FOR A FULL DESCRIPTION OF GFG CAPITAL’S ADVISORY SERVICES AND FEES, PLEASE REFER TO OUR FORM ADV PART 2 DISCLOSURE BROCHURE AVAILABLE BY REQUEST OR AT THE FOLLOWING WEBSITE: HTTP://WWW.ADVISERINFO.SEC.GOV/.
ALL COMMUNICATIONS, INQUIRIES AND REQUESTS FOR INFORMATION RELATING TO THIS PRESENTATION SHOULD BE ADDRESSED TO GFG CAPITAL AT 305-810-6500.