

Ask any investor which events in their investing lifecycle are the most painful to recall, and you’re likely to hear either the Great Financial Crisis, the Dot.com Bubble, or the Pandemic. But one period of recent history that most of us experienced together, but don’t often receive much credit for generating meaningful scar tissue, was the calendar year of 2017. By many metrics, 2017 was the least volatile year for stocks on record. One impressive datapoint from the 2017 campaign is the fact that 96% of the trading days had a price movement between -1% and +1% for the S&P 500. Since 1928, the average for any given year is closer to 76%. Additionally, in 2017 the VIX recorded its lowest close on record (9.51) and had an average reading of 11 (long-term average is 20). The quietest market we’ve ever seen caused investors to wait around for a year anticipating for the hammer to be dropped on their heads. And it never did. In fact, the S&P 500 finished the year higher by ~22%[1]. But the anxiety that was induced by a market that seemed to lull investors to sleep, led to itchy trigger fingers across portfolios and a seemingly unbeatable urge to purchase portfolio insurance. When in fact, patience was the best strategy for that quiet market. Today, investors are grappling with a similarly anxiety inducing, calm challenge.
[1] All data provided by Bloomberg database.
Hurry Up and Wait
Many investors might be surprised to learn that for the last two years, the S&P 500 has been absolutely, positively flat. It’s gone nowhere. Here, take a look [2]:
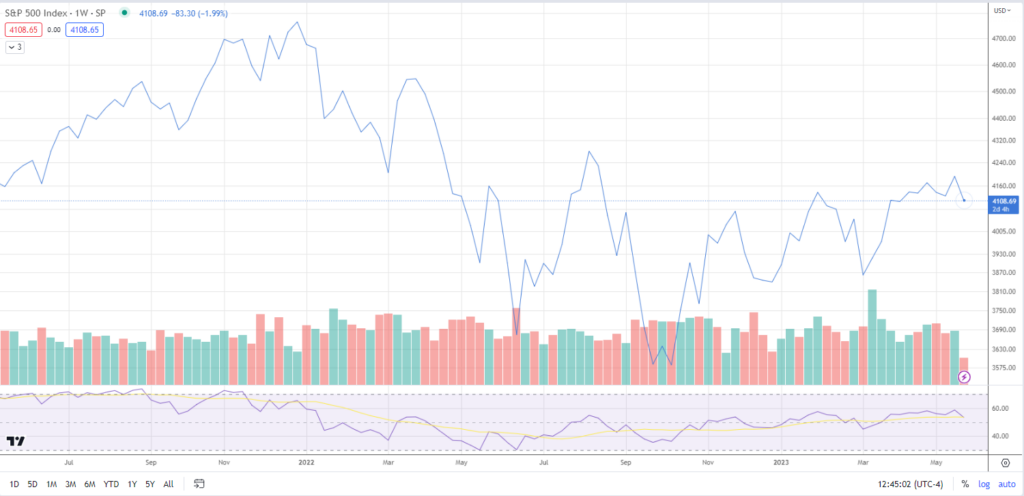
[2] Chart provided by TradingView, as of 5/24/2023
Similar to the outlier nature of 2017, these last 24 months are a rare occurrence. In fact, if you lined up rolling 24 month returns for the S&P 500 since 1950, you’re going to find that the index has a 24 month return between -1% and +1% only 3% of the time. And through May 24th, the trailing 24-month return is exactly 1% on a total return basis[3].
What’s more is, this recent stretch of time has been supremely quiet, all while the headlines surrounding the market have grown increasingly dire. The last 8 weeks have seen the S&P 500 close at almost an identical price point (a range of 60 basis points), and the current week is on pace for extending this trend. In the last two years, this feat has only been topped once, back in the Spring of 2021 when the index went 11 consecutive weeks with a closing price within in basis points of each other[4].
The super scholarly term for these occurrences is something we like to refer to as a Technical Torture Box. Don’t bother Googling that, or asking Bard, or ChatGPT. You’re more likely to learn about Guantanamo Bay than you are the stock market with the results you receive. But it’s when the near-term trend seems non-existent, and market participants begin to crave a resolution so badly that they become apathetic to the direction the market ultimately takes.
But this torture box that investors are forced to grapple with is less of a test of their portfolio, or strategy, and more of a test of their patience.
A calm, sideways market can be triggering for investors because it doesn’t provide the feedback loop of instant gratification. If you’re not being given constant feedback on whether or not your strategy is working, you might start to second guess what you’re doing in the first place. The urge to act might feel like the right thing to do, in order for you to dodge a bullet. Humans don’t handle ambiguity well, and therefore don’t thrive in these types of markets.
After a down market, we have an urge to sell certain positions because it feels like the right thing to do. The Greener Grass fallacy is perhaps most on display in these times. Following a strong rally, we are susceptible to overconfidence because the signals we’re receiving from the market is that our decisions were the right ones. Naturally, we must be geniuses. Both biases are challenges in their own right, but the slow burn of nothingness we’ve been collectively watching for the last couple of months is uniquely frustrating.
In these sideways trending markets, advising investors is equally as difficult. Most investors seeking professional help might be on the hunt for some form of confirmation bias. A proposal for a hedge, or hearing “let’s take some risk off the table” are likely going to make an investor feel better about their advisers. But these approaches tend to dismiss the other side of those strategies, which is: when do you add risk back? “Be more patient” in investing is the “sleep 8 hours” of health. It sounds too simple, and borderline patronizing, to take seriously but will probably make a bigger difference than anything else you do.
One critical thing to keep in mind for investors is that investing for personal wealth purposes is akin to endurance sports. And training for sports that require world class levels of conditioning isn’t centered around maximum output in every session. Peak performance is attained when training programs are consistent, and sustainable. Chronic levels of intense stress on the mind and body within a training program can lead an athlete to burnout or even worse, injury.
An investor’s time in the market is no different when it comes to approach. Maximizing the future value of your portfolio isn’t going to be accomplished by trying to maximize every daily, weekly, or even monthly move. The hit rate and stress involved in these approaches aren’t sustainable. Maximum future value is only attainable when the program (a financial plan and investment strategy) is consistent and sustainable. Remaining mindful of our investment endurance programs when the market finds itself in limbo is the first line of defense our portfolios have.
[3] Data provided by Bloomberg database.
[4] Data provided by Bloomberg database.
LEGAL STUFF
CURRENT MARKET DATA IS AS OF 5/24/2023. OPINIONS AND PREDICTIONS ARE AS OF 5/24/2023 AND ARE SUBJECT TO CHANGE AT ANY TIME BASED ON MARKET AND OTHER CONDITIONS. DISCUSSION OF SPECIFIC PUBLICLY TRADED STOCKS IS ONLY INCLUDED FOR ILLUSTRATIVE PURPOSES ONLY AND NOT A RECOMMENDATION. NO PREDICTIONS OR FORECASTS CAN BE GUARANTEED. INFORMATION CONTAINED HEREIN HAS BEEN OBTAINED FROM SOURCES BELIEVED TO BE RELIABLE BUT IS NOT GUARANTEED.
THIS MATERIAL DOES NOT CONSTITUTE A RECOMMENDATION TO BUY OR SELL ANY SPECIFIC SECURITY, PAST PERFORMANCE IS NOT INDICATIVE OF FUTURE RESULTS. INVESTING INVOLVES RISK, INCLUDING THE POSSIBLE LOSS OF A PRINCIPAL INVESTMENT.
THIS PRESENTATION (THE “PRESENTATION”) HAS BEEN PREPARED SOLELY FOR INFORMATION PURPOSES AND IS NOT INTENDED TO BE AN OFFER OR SOLICITATION AND IS BEING FURNISHED SOLELY FOR USE BY CLIENTS AND PROSPECTIVE CLIENTS IN CONSIDERING GFG CAPITAL, LLC (“GFG CAPITAL” OR THE “COMPANY”) AS THEIR INVESTMENT ADVISER. DO NOT USE THE FOREGOING AS THE SOLE BASIS OF INVESTMENT DECISIONS. ALL SOURCES DEEMED RELIABLE HOWEVER GFG CAPITAL ASSUMES NO RESPONSIBILITY FOR ANY INACCURACIES. THE OPINIONS CONTAINED HEREIN ARE NOT RECOMMENDATIONS.
INDEX PERFORMANCE IS PRESENTED FOR ILLUSTRATIVE PURPOSES ONLY. DIRECT INVESTMENT CANNOT BE MADE INTO AN INDEX. THE S&P 500 INDEX IS AN UNMANAGED INDEX, WHICH IS WIDELY REGARDED AS THE STANDARD FOR MEASURING THE U.S. STOCK MARKET PERFORMANCE. INVESTMENT IN EQUITIES INVOLVES MORE RISK THAN OTHER SECURITIES AND MAY HAVE THE POTENTIAL FOR HIGHER RETURNS AND GREATER LOSSES. BONDS HAVE INTEREST RATE RISK AND CREDIT RISK. AS INTEREST RATES RISE, EXISTING BOND PRICES FALL AND CAN CAUSE THE VALUE OF AN INVESTMENT TO DECLINE. CHANGES IN INTEREST RATES GENERALLY HAVE A GREATER EFFECT ON BONDS WITH LONGER MATURITIES THAN ON THOSE WITH SHORTER MATURITIES. CREDIT RISK REFERES TO THE POSSIBLITY THAT THE ISSUER OF THE BOND WILL NOT BE ABLE TO MAKE PRINCIPAL AND/OR INTEREST PAYMENTS.
THE INFORMATION CONTAINED HEREIN HAS BEEN PREPARED TO ASSIST INTERESTED PARTIES IN MAKING THEIR OWN EVALUATION OF GFG CAPITAL AND DOES NOT PURPORT TO CONTAIN ALL OF THE INFORMATION THAT A PROSPECTIVE CLIENT MAY DESIRE. IN ALL CASES, INTERESTED PARTIES SHOULD CONDUCT THEIR OWN INVESTIGATION AND ANALYSIS OF GFG CAPITAL AND THE DATA SET FORTH IN THIS PRESENTATION. FOR A FULL DESCRIPTION OF GFG CAPITAL’S ADVISORY SERVICES AND FEES, PLEASE REFER TO OUR FORM ADV PART 2 DISCLOSURE BROCHURE AVAILABLE BY REQUEST OR AT THE FOLLOWING WEBSITE: HTTP://WWW.ADVISERINFO.SEC.GOV/.
ALL COMMUNICATIONS, INQUIRIES AND REQUESTS FOR INFORMATION RELATING TO THIS PRESENTATION SHOULD BE ADDRESSED TO GFG CAPITAL AT 305-810-6500.