

The dog days of summer are technically behind us, but the second half of the month of August has certainly felt the most dog day any stretch of days could possibly feel. A confluence of coincidental seasonal variables has aligned, along with a significant rally in stocks in the first half of the year, which has handed investors the first sign of turbulence for 2023. A closer look at seasonal trends, and where the first half leaders stand today should be useful for investors to shape their expectations as we inch closer to fall.
The Dog Days Are Not Over
Often, when you hear something pertaining to the market that sounds like it’s purely an anecdote, it tends to be simply that. But when investors explain the doldrums of summer in the market by referencing summer holidays in the Hamptons, there’s a bit of truth to that. Which is why we tend to see lower trading volumes and volatility in the first couple of months of the season. Here’s a look at historical trading data over a 115-year period ending in 2003 from the NYSE [1]:
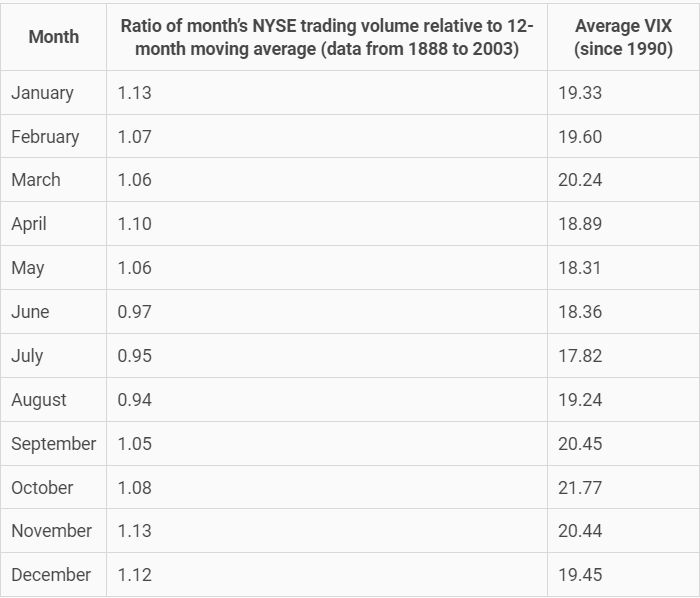
[1] Chart provided by TheStreet.com, data provided by NYSE. The analysis is cut off in the early 2000s, since that’s when computer-driven trading (such as high-frequency trading (HFT)) began to skew the trading volume data.
A ratio above 1 in the table means that the month’s volume is higher than the previous 12-month average, whereas a reading below 1 means that it is lower.
When you combine the annual season quiet period with the four-year presidential cycle, when we entered August, we embarked on the beginning of the worst stretch of time for stocks based on this historical data. The August-September window in the year prior to a general election [2]:
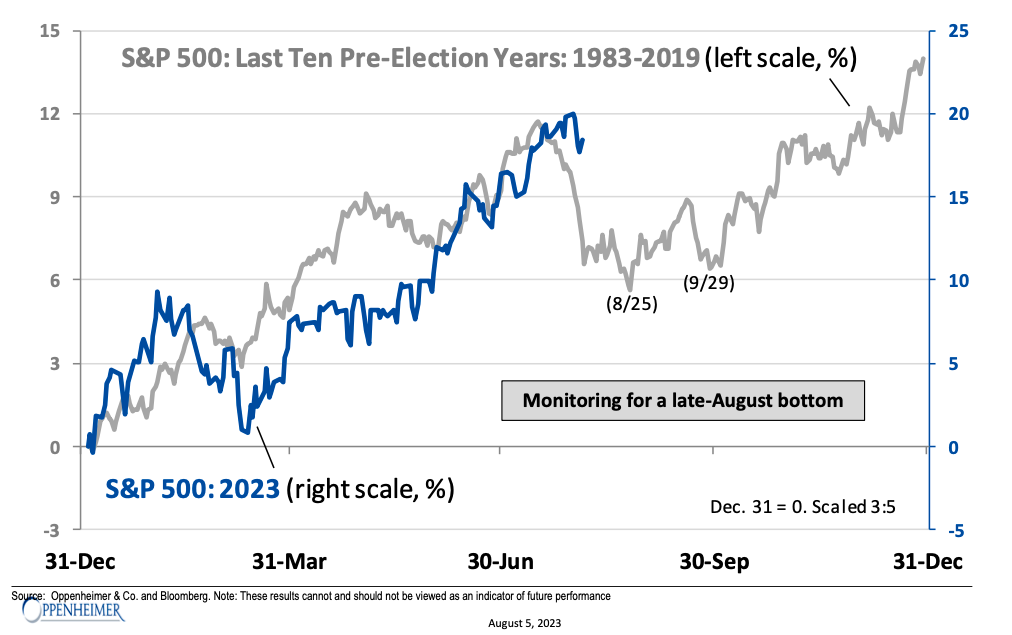
[2] Chart provided by Oppenheimer, as of 8/17/2023.
Through August 24th, the S&P 500 had posted a -4.5% return for the month. In the same way one could argue markets pulled forward gains in the first 7 months of the year, with SPX down -1.59% in August alone, it may have pulled forward the average, seasonal monthly decline for September [3]:
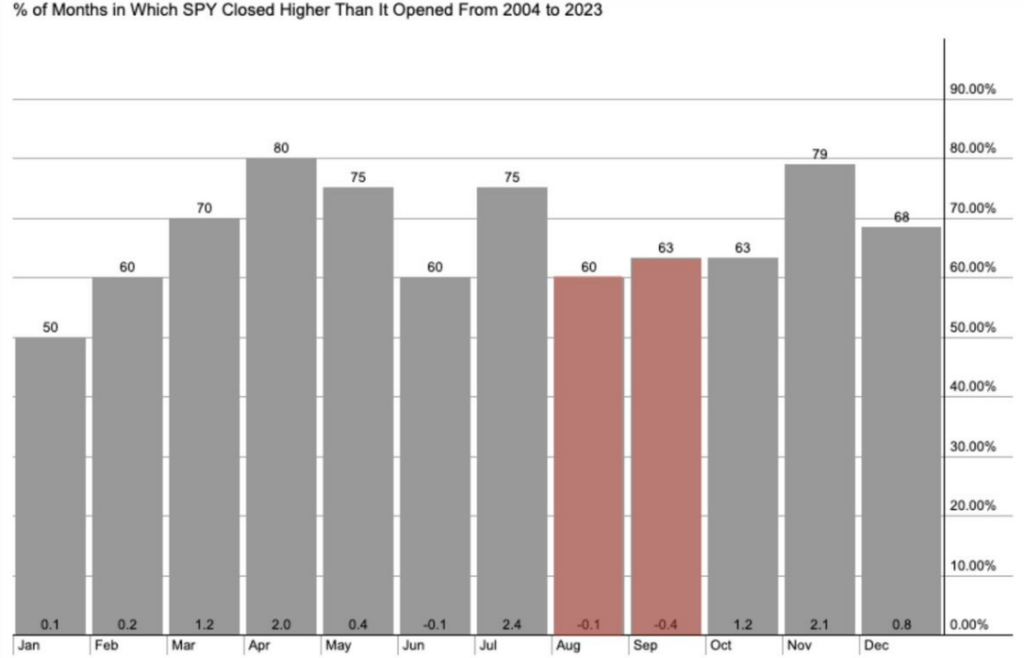
[3] Chart provided by Finom group.
So now that we understand where the calendar has brought us in terms of seasonal expectations, let’s take a look at some of the strongest parts of the market in the first 7 months of this year, and where they stand on a technical level.
Let’s start with the broader market as a whole. Take a look at where the August selloff has brought the S&P 500 [4]:
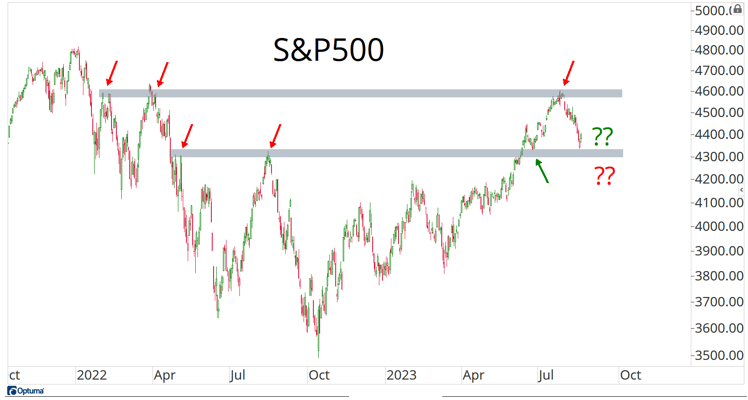
[4] Chart provided by AllStar Charts, Date Range: Oct 2022 – Aug 2023.
Now, a look under the hood at some of the strongest industry groups to start the year [5]:
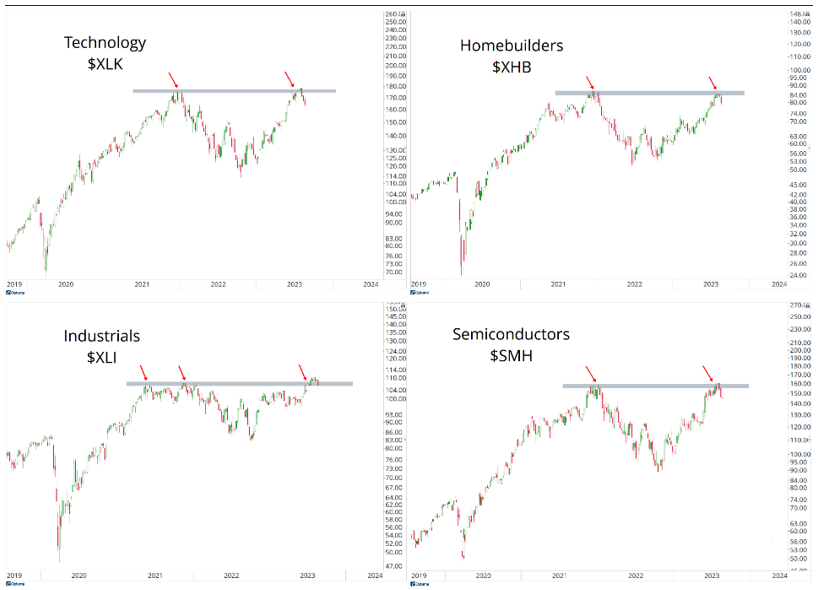
[5] Chart provided by AllStar Charts, Date Range: Aug 2019 – Aug 2023.
Each of these four segments of the market that not only have been leaders for the year but are tied tightly to the cyclical nature of the market have rallied right up into their 2021 highs as of the end of July. This is also referred to as overhead supply. With these pockets of the market trying to digest the overhead resistance, it’s logical to connect the dots that further consolidation is in the cards for the next couple of months as seasonality, and gains from the beginning of the year are further digested.
What should investors be on the lookout for through the rest of the summer?
On the equity side of the conversation, you’d like to see some leadership from laggards in the first half of the year. Energy might be best suited to carry the baton into fall. But you also will need to keep a close eye on yields across the Treasury curve. It will be difficult for the market to recapture its highs from the year with continued upward pressure across the belly and long end of the curve. Take a look [6]:
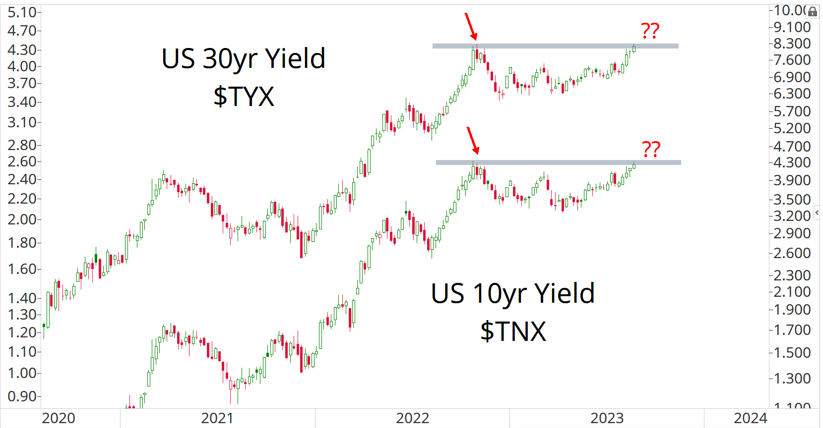
[6] Chart provided by AllStar Charts, Date Range: Jan 2020 – Aug 2023
Even when you consider the recent Atlanta Fed GDPNow Tracker estimating a 5.9% GDP figure in Q3, it isn’t easy to just assume that the two rates on the chart above resolve higher above the current range. Keep in mind that these rates are more sensitive to growth expectations and inflation expectations, and that both of those have been cooled significantly in recent months.
Perhaps what is the leading indicator for the longer ends of the curve, is the behavior of the short end [7]:
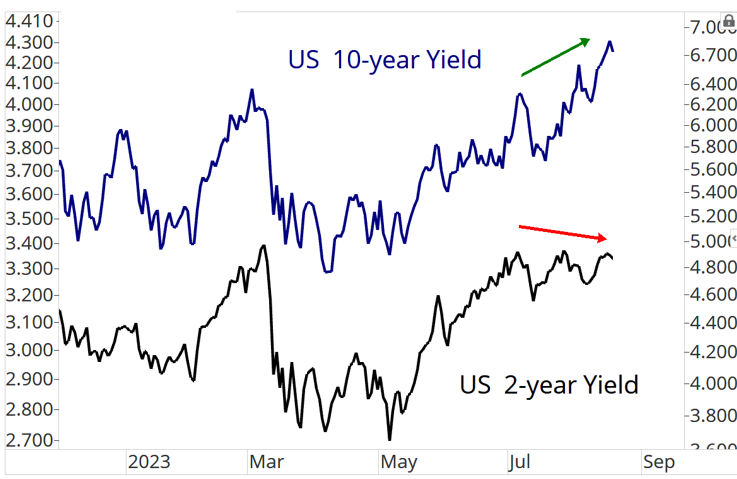
[7] Chart provided by AllStar Charts, Date Range: Jan 2023 – Aug 2023
While yields further out on the curve have picked up since July, the front end of the curve has continued to trend lower, creating the first appearance of divergence between shorter- and longer-term rates in about a year. The 2-year yield is generally interpreted as a shadow Fed Funds Rate and has been a leading indicator for the rest of the curve for the entirety of the current monetary cycle. It would be brash to assume that this relationship will change on a dime, right here, right now.
LEGAL STUFF
CURRENT MARKET DATA IS AS OF 8/24/2023. OPINIONS AND PREDICTIONS ARE AS OF 8/24/2023 AND ARE SUBJECT TO CHANGE AT ANY TIME BASED ON MARKET AND OTHER CONDITIONS. NO PREDICTIONS OR FORECASTS CAN BE GUARANTEED. INFORMATION CONTAINED HEREIN HAS BEEN OBTAINED FROM SOURCES BELIEVED TO BE RELIABLE BUT IS NOT GUARANTEED.
THIS PRESENTATION (THE “PRESENTATION”) HAS BEEN PREPARED SOLELY FOR INFORMATION PURPOSES AND IS NOT INTENDED TO BE AN OFFER OR SOLICITATION AND IS BEING FURNISHED SOLELY FOR USE BY CLIENTS AND PROSPECTIVE CLIENTS IN CONSIDERING GFG CAPITAL, LLC (“GFG CAPITAL” OR THE “COMPANY”) AS THEIR INVESTMENT ADVISER. DO NOT USE THE FOREGOING AS THE SOLE BASIS OF INVESTMENT DECISIONS. ALL SOURCES DEEMED RELIABLE HOWEVER GFG CAPITAL ASSUMES NO RESPONSIBILITY FOR ANY INACCURACIES. THE OPINIONS CONTAINED HEREIN ARE NOT RECOMMENDATIONS.
THIS MATERIAL DOES NOT CONSTITUTE A RECOMMENDATION TO BUY OR SELL ANY SPECIFIC SECURITY, PAST PERFORMANCE IS NOT INDICATIVE OF FUTURE RESULTS. INVESTING INVOLVES RISK, INCLUDING THE POSSIBLE LOSS OF A PRINCIPAL INVESTMENT.
INDEX PERFORMANCE IS PRESENTED FOR ILLUSTRATIVE PURPOSES ONLY. DIRECT INVESTMENT CANNOT BE MADE INTO AN INDEX. THE S&P 500 INDEX IS AN UNMANAGED INDEX, WHICH IS WIDELY REGARDED AS THE STANDARD FOR MEASURING THE U.S. STOCK MARKET PERFORMANCE. THE VIX INDEX IS BASED ON OPTIONS OF THE S&P 500 INDEX AND IS RECOGNIZED AS THE WORLD’S PREMIER GAUGE OF U.S. EQUITY MARKET VOLATILITY. INVESTMENT IN EQUITIES INVOLVES MORE RISK THAN OTHER SECURITIES AND MAY HAVE THE POTENTIAL FOR HIGHER RETURNS AND GREATER LOSSES.
THE INFORMATION CONTAINED HEREIN HAS BEEN PREPARED TO ASSIST INTERESTED PARTIES IN MAKING THEIR OWN EVALUATION OF GFG CAPITAL AND DOES NOT PURPORT TO CONTAIN ALL OF THE INFORMATION THAT A PROSPECTIVE CLIENT MAY DESIRE. IN ALL CASES, INTERESTED PARTIES SHOULD CONDUCT THEIR OWN INVESTIGATION AND ANALYSIS OF GFG CAPITAL AND THE DATA SET FORTH IN THIS PRESENTATION. FOR A FULL DESCRIPTION OF GFG CAPITAL’S ADVISORY SERVICES AND FEES, PLEASE REFER TO OUR FORM ADV PART 2 DISCLOSURE BROCHURE AVAILABLE BY REQUEST OR AT THE FOLLOWING WEBSITE: HTTP://WWW.ADVISERINFO.SEC.GOV/.
ALL COMMUNICATIONS, INQUIRIES AND REQUESTS FOR INFORMATION RELATING TO THIS PRESENTATION SHOULD BE ADDRESSED TO GFG CAPITAL AT 305-810-6500.