

The daily monitoring of stock prices and bond yields might help some investors get a sense of what is going on within the capital markets. For stocks, many check hourly, daily, or weekly to see if the price of equities has moved higher or lower. Generally, many investors will do the same with Treasury yields, especially over the last 2 years. If an investor were to be checking the prices of stocks and noticed a trend of lower prices, it’s only natural to begin to think something is fundamentally wrong with the market and economy. But what a typical investor doesn’t do enough (in our opinion) is take the additional step to analyze the bond market, in order to confirm their thesis on the stock market. Here’s a look at some signals from the fixed income universe in order to help interpret the recent weakness in stocks.
Credit Spreads
We look at these regularly as a gut-check on short-term equity price trends since both stocks and corporate bond prices rely on investor confidence in future cash flows/earnings. Increasing spreads are somewhat analogous to falling price/earnings multiples; both show concern that future corporate fundamentals will not be as strong as previously expected.
The chart below shows investment grade (black line, left axis) and high yield (red line, right axis) spreads from the start of 2022 to the present [1]:
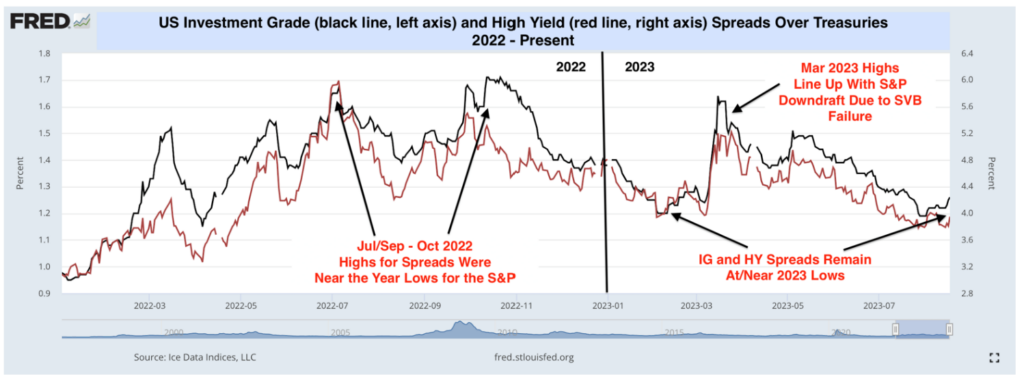
[1] Chart provided by FRED, as of 8/21/2023.
As noted, every major low for the S&P over the last 18 months has come with unusually high corporate bond spreads. This was the case in June/July and September/October 2022 and March 2023. Spreads at present remain remarkably low, at 1.53% over Treasuries for investment grade corporates and 3.84% for high yield bonds [2]. This is very close to the pre-SVB February 2023 lows of 1.20/3.95 and the July 31st lows of 1.19/3.79, which coincide with the S&P’s record close for the year to date.
The S&P 500 is off 2.5% from its July 31st YTD closing high, but corporate bond spreads have barely budged, and that tells us something. Let’s put aside the possibility that bond investors are just slow; their track record over the last year and a half is pretty good at fretting just as quickly as stock investors about macro risks. The disparity seen in August must come down to something that is unique to stocks, and that is equity valuations. Moreover, it’s not just the tech-heavy market-cap-weighted S&P 500 that suffered in August. The even-weight S&P 500 was down 3.16%.
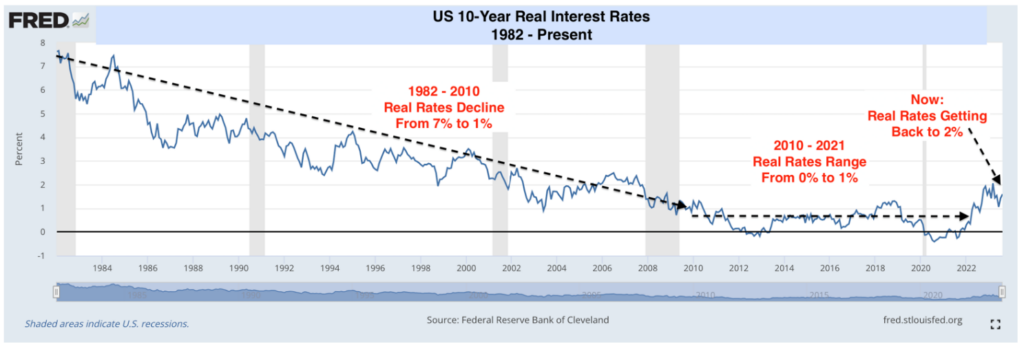
As for what is causing this multiple compression in US large caps, our primary explanation remains the recent increase in real interest rates. These have increased sharply since July 31st, going from 1.60% to 1.97%. The latter is a new decade-plus high and a level we have not seen since July 2009. The movement we’ve seen in real rates is the dark side of the slowing inflation we’ve seen over the last 16 months. When inflation falls, but yields hold firm, real rates move higher. We continue to believe equity markets will be under pressure until real rates stabilize. Here’s a look at where real rates are today, relative to their historical levels [3]:
[2] Data provided by Bloomberg Database, as of 9/12/2023. IG spread of 1.52% references BBB-rated corporate bonds.
[3] Chart provided by FRED, as of 8/21/2023.
Three thoughts about what all this means for changes in capital market narratives:
First, we reiterate our belief that if long-term interest rates continue to rise, they will be destined to cause further equity market uncertainty. Markets hate the “U word”, so we’re in for more tough days over the next few weeks. This will hit high-multiple stocks more than most, which means this year’s leaders should remain under pressure in the early part of the third quarter.
Second, over the short term, higher real Treasury yields should mean a stronger dollar. Global investors will read that as a “risk off” signal, which means non-US equity markets may struggle even more than domestic stock indices.
Third, we wonder WWCPS (What Would Chair Powell Say) about all this.
Higher real yields across the Treasury curve help their efforts to reduce consumption and inflation, so that’s good.
The other side of the trade is that higher yields/lower bond prices put pressure on bank balance sheets. We saw what that means in March with the failure of SVB.
On top of that, if the Treasury bond selloff starts to cascade, they will be in the unenviable position of deciding what to do about their balance sheet reduction program. The Fed needs to “stay in its lane”, as Chair Powell so often says. Therefore, it cannot be seen as coming to the rescue of a market that is finally discounting longer run issues like excessive Federal spending.
The Fed is realistically only at the beginning of trying to normalize rates after 15 years of real rates being ‘un-real.’ This will take time and its drivers are complex and interrelated in ways markets do not fully understand in large part because it’s been so long since real rates were a topic of discussion. We remain longer-term bullish on US equities because none of what we’ve discussed today should threaten economic growth over the next 1-2 years and therefore we believe corporate earnings should remain robust.
LEGAL STUFF
CURRENT MARKET DATA IS AS OF 9/12/2023. OPINIONS AND PREDICTIONS ARE AS OF 8/21/2023 AND ARE SUBJECT TO CHANGE AT ANY TIME BASED ON MARKET AND OTHER CONDITIONS. NO PREDICTIONS OR FORECASTS CAN BE GUARANTEED. INFORMATION CONTAINED HEREIN HAS BEEN OBTAINED FROM SOURCES BELIEVED TO BE RELIABLE BUT IS NOT GUARANTEED.
THIS PRESENTATION (THE “PRESENTATION”) HAS BEEN PREPARED SOLELY FOR INFORMATION PURPOSES AND IS NOT INTENDED TO BE AN OFFER OR SOLICITATION AND IS BEING FURNISHED SOLELY FOR USE BY CLIENTS AND PROSPECTIVE CLIENTS IN CONSIDERING GFG CAPITAL, LLC (“GFG CAPITAL” OR THE “COMPANY”) AS THEIR INVESTMENT ADVISER. DO NOT USE THE FOREGOING AS THE SOLE BASIS OF INVESTMENT DECISIONS. ALL SOURCES DEEMED RELIABLE HOWEVER GFG CAPITAL ASSUMES NO RESPONSIBILITY FOR ANY INACCURACIES. THE OPINIONS CONTAINED HEREIN ARE NOT RECOMMENDATIONS.
THIS MATERIAL DOES NOT CONSTITUTE A RECOMMENDATION TO BUY OR SELL ANY SPECIFIC SECURITY, PAST PERFORMANCE IS NOT INDICATIVE OF FUTURE RESULTS. INVESTING INVOLVES RISK, INCLUDING THE POSSIBLE LOSS OF A PRINCIPAL INVESTMENT.
INDEX PERFORMANCE IS PRESENTED FOR ILLUSTRATIVE PURPOSES ONLY. DIRECT INVESTMENT CANNOT BE MADE INTO AN INDEX. THE S&P 500 INDEX IS AN UNMANAGED INDEX, WHICH IS WIDELY REGARDED AS THE STANDARD FOR MEASURING THE U.S. STOCK MARKET PERFORMANCE. INVESTMENT IN EQUITIES INVOLVES MORE RISK THAN OTHER SECURITIES AND MAY HAVE THE POTENTIAL FOR HIGHER RETURNS AND GREATER LOSSES. BONDS HAVE INTEREST RATE RISK AND CREDIT RISK. AS INTEREST RATES RISE, EXISTING BOND PRICES FALL AND CAN CAUSE THE VALUE OF AN INVESTMENT TO DECLINE. CHANGES IN INTEREST RATES GENERALLY HAVE A GREATER EFFECT ON BONDS WITH LONGER MATURITIES THAN ON THOSE WITH SHORTER MATURITIES. CREDIT RISK REFERES TO THE POSSIBLITY THAT THE ISSUER OF THE BOND WILL NOT BE ABLE TO MAKE PRINCIPAL AND/OR INTEREST PAYMENTS.
THE INFORMATION CONTAINED HEREIN HAS BEEN PREPARED TO ASSIST INTERESTED PARTIES IN MAKING THEIR OWN EVALUATION OF GFG CAPITAL AND DOES NOT PURPORT TO CONTAIN ALL OF THE INFORMATION THAT A PROSPECTIVE CLIENT MAY DESIRE. IN ALL CASES, INTERESTED PARTIES SHOULD CONDUCT THEIR OWN INVESTIGATION AND ANALYSIS OF GFG CAPITAL AND THE DATA SET FORTH IN THIS PRESENTATION. FOR A FULL DESCRIPTION OF GFG CAPITAL’S ADVISORY SERVICES AND FEES, PLEASE REFER TO OUR FORM ADV PART 2 DISCLOSURE BROCHURE AVAILABLE BY REQUEST OR AT THE FOLLOWING WEBSITE: HTTP://WWW.ADVISERINFO.SEC.GOV/.
ALL COMMUNICATIONS, INQUIRIES AND REQUESTS FOR INFORMATION RELATING TO THIS PRESENTATION SHOULD BE ADDRESSED TO GFG CAPITAL AT 305-810-6500.