

“Diversification is the only free lunch” is a fallacy that’s been pushed on investors for a long time. We’ve vocally disagreed with this premise in the past. No lunch is free. Some are just cheaper. But that also doesn’t mean all lunches are the same. And when it comes to the stock market, if you want a bigger lunch, you’re going to have to pay for it. One way or the other. Sometimes A lot of the time, in the stock market when you think you’ve found an individual stock that is going to handsomely outperform, there’s a price you have to pay for that return. We don’t mean the actual price per share. We’re also not getting at valuation premiums. We’re talking about volatility.
Market pundits and commentators are quick to bring up individual companies that have outpaced the market considerably over various time frames. Dangling this fruit in front of investors who purchased low-cost indexed funds thinking they were doing the right thing, as if to say, “Look what you’ve passed up on.”
But investors aren’t being shown the whole story. To us, most of the time these returns are being advertised as no-brainer overnight success stories. “Don’t worry how we got here, just look at what the result was.” These returns are always discussed by commentators with the benefit of 20/20 hindsight. But the reality of markets, and life, is that there’s no such thing as an overnight success. Success is hard. It’s a time consuming, mentally and physically draining test of talent, skill and fortitude that requires you to be stretched beyond your perceived comfort levels. We think this is a reality of just about anything in life, but markets grant us this somewhat personified metric to gauge this comfort zone (and success) in real time in asset prices. This can be applied to other notable success stories in our society and culture. Lebron James? Bryce Harper? Pick a teenage sports phenom who seemingly exploded onto the national stage out of nowhere. Even at young ages of 18 years old, these guys didn’t just snap their fingers and were magically head and shoulders above their competition.
The same way we hone in on the returns of a stock today over “N” amount of years, we’re only seeing the finished product of these athletes. We’re not seeing the 5 a.m. wake-up call, we’re not shooting with them in the gym and we’re not there for the hundreds of batting practice sessions taken in solitude. Nor are we granted access to the mental state of these athletes (read: humans) throughout this entire process. The peaks which justify each and every sacrifice that was made up until that moment, and the valleys that force them to question every decision or perception they’ve ever had about themselves. And their choices. Bringing them to the brink of quitting. Lebron James isn’t Lebron James just because he’s 6’8” and 275lbs. Lebron James the human is Lebron James the G.O.A.T. because he refused to not execute.
If you were able to buy stock in Lebron James, Bryce Harper, Lionel Messi, Cristiano Ronaldo or any athlete who’s seemingly dominated their respective sport since birth, your return wouldn’t have been an upward sloping crescendo. We’re here to tell you from experience.
Now replace those athletes with some of the most popular stocks in the market today; we think the parallels are pretty staggering. Humans chasing success in sports isn’t much different than humans chasing success in business and subsequently investing. The only difference is public markets are, well, public. As a CEO, your intermittent successes and failures are on full display for everyone to see. And they get to share their opinion with you by helping fund your long-term vision or defunding it.
Just like the world’s best athletes, the world’s best-performing stocks continuously failed and fell along the way. Most notably we can point to the recent price decline in shares of Facebook. Literally one of the most widely held stocks in the world, Facebooks shares have outpaced the broader market since its IPO hand over fist. But that didn’t come without a cost. We think if you’ve purchased shares of an individual company, your commitment goes beyond the ticker. You’ve just agreed to the company’s long-term vision and are willing to help fund the journey. If you want the benefits that you think exist at the end of the process, you’re going to have to wear some lumps along the way. Check out the below graph.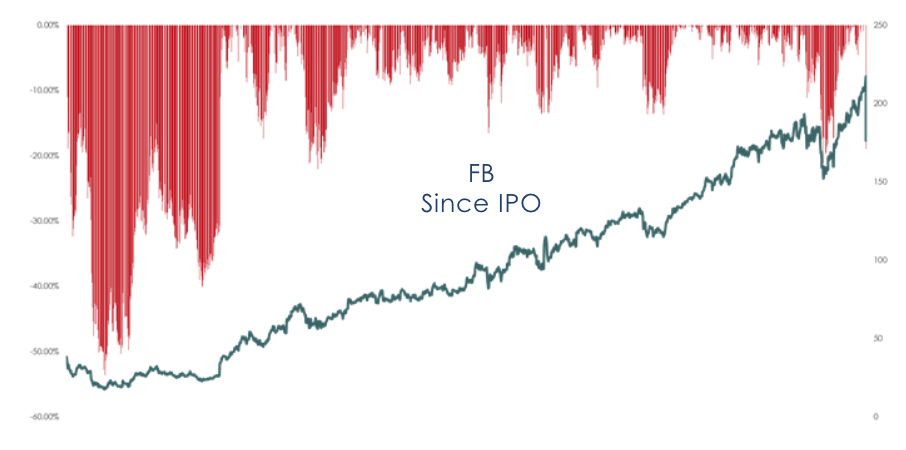
The end result, that is routinely flashed on screens is the 364% returned to shareholders in the roughly six-year time horizon. Sounds nice, right? Sure, if you were willing to experience the drawdowns (shown in red) during this time. If you were committed to Facebook’s vision you withstood a 53% drawdown that bottomed in 2012 just a few months following the IPO. Over the life of Facebook’s publicly traded stock, it’s experienced average drawdowns of 9.89% from its trailing all-time high price. It might come as a shock to many who’ve associated this stock, along with its FANG acronym counterparts, with one direction numbers1. But if you were able to stomach this price volatility, you outpaced the S&P 500 by 190%2. How strong is your conviction? Or your stomach?
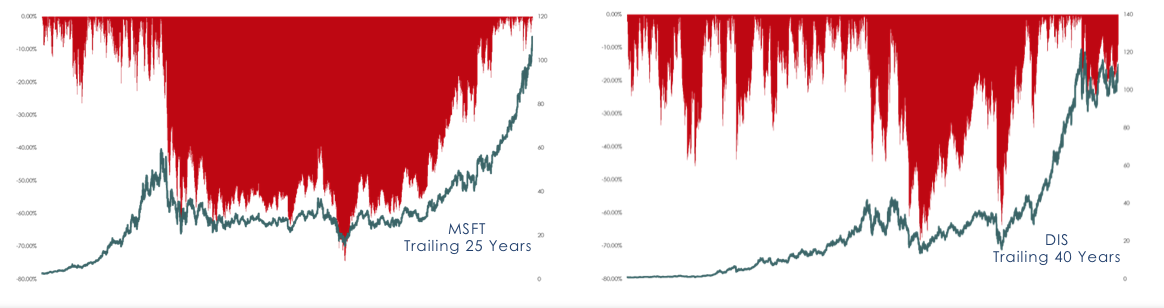
The story is widely the same for any stock that has spent time atop of their respective industry, and even the market. Take a look at Microsoft (left) and Disney (right) below. Over the 25-and 40-year periods highlighted for each chart, respectively, the drawdowns illustrated in red are something from a horror movie. But this is the reality of picking winners. Winners get hit and take it in stride. The best management understands the short-sited nature of “The Street” and doesn’t sacrifice the long-term vision to appease it. Because of this, Microsoft was able to weather -75% drawdowns from their previous highs in this period while delivering 6,536% to shareholders in total return. This compares to 884% of the S&P 500. Disney? Over 40 years, the company’s stock was able to return 19,464% to shareholders vs 8,356% of the market. This didn’t come without a max drawdown of -68% from its previous peak in the period.
The market darling, Amazon quite possibly is the best example of this. Take a look below.
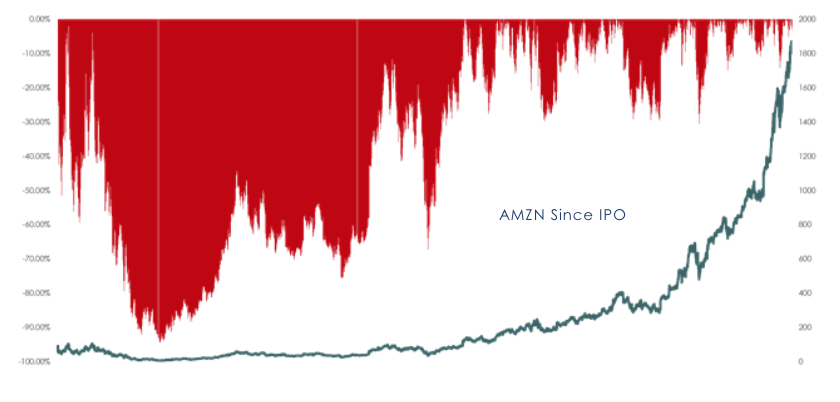
Amazon might seem bulletproof today, but the drawdowns the stock has experienced are some of the most extreme we’ve seen in recent history. Between the company’s IPO (1997) and the end of 2016, the stock tallied at least one double digit decline in the calendar year. Over the last twenty years, the steepest drawdown from the previous all-time was 94.4% in September of 2001. If you read Jeff Bezos’ letter to investors in 1997 and were fully onboard, you’ve been rewarded 120,651% vs 309% for the market3. But it wasn’t free, it wasn’t gradual, and it certainly wasn’t overnight.
SOURCE: This presentation is solely for informational purposes and should not be taken as investment advice. For further information, please contact one of our investment adviser representatives. 1 Data provided by Bloomberg, chart created by GFG Capital. 2 Data provided by Bloomberg, chart created by GFG Capital. 3 Data provided by Bloomberg, chart created by GFG Capital. GFG Capital carries direct and indirect exposure to each of the securities discussed in this piece.
LEGAL STUFF
THIS PRESENTATION (THE “PRESENTATION”) HAS BEEN PREPARED SOLELY FOR INFORMATION PURPOSES AND IS NOT INTENDED TO BE AN OFFER OR SOLICITATION AND IS BEING FURNISHED SOLELY FOR USE BY PROSPECTIVE CLIENTS IN CONSIDERING GFG CAPITAL, LLC (“GFG CAPITAL” OR THE “COMPANY”) AS THEIR INVESTMENT ADVISOR. THE OPINIONS CONTAINED HERIN ARE NOT RECOMMENDATIONS.