

The focus of the global economy, and global markets, for the better part of 2 years has been monetary policy and inflation. You couldn’t escape a conversation about anything that had to do with consumerism or investing without an explanation, or a pontification, seeming to come back to those two points. Over a year ago, one of the most respected figures in the global economy warned all of us (literally a global warning) to brace ourselves for an economic hurricane that was on the horizon. What’s unfolded in front of our eyes isn’t necessarily an illustration of what’s been presented to us. But instead, the landscape that’s been painted is largely a product of what hasn’t happened. Through the first half of the year, investors haven’t been forced to trade through a recession that has been ‘imminent’ for two years, 10 months of uninterrupted interest rate hikes haven’t thrown a wrench in the labor market, the economy has turned out to not be so interest rate sensitive- allowing for credit to flow freely, multiple bank failures didn’t seize the entire banking sector, and whips in the Treasury market haven’t caught traders or hedge funds significantly off guard. The story of 2023 has been much more about what hasn’t happened, than what has transpired this year. So, let’s look at how the rest of this story may unfold.
Hurricane Season
Ironically, hurricane season began last month and we’re, technically, disturbingly ahead of schedule. We’ve had four named storms in the Atlantic so far, but water temperatures in the Atlantic were hitting levels in June that are not typically seen until August. In fact, there have been waters in shallow coastal areas surrounding Florida that have registered 101 degrees Fahrenheit [1]. So, Jamie Dimon could have been right if he’d clarified he meant actual hurricanes. Now, I’m not trying to pile onto the CEO of J.P. Morgan for his comments last year, I actually think he was just trying to do the exact opposite of what banking CEOs were doing ahead of the Great Financial Crisis. But the idea that this hurricane was on the horizon was something investors across the world adopted and prepped for. Buying up as many packages of toilet paper and T-Bills as they could get their hands on. Both professional and retail investors were flocking to short term T-Bills, and many still are. As of July, cash was the largest overweight position for professional money managers according to Bank of America Fund Manager Survey:
[1] Barron’s, 7/25/2023
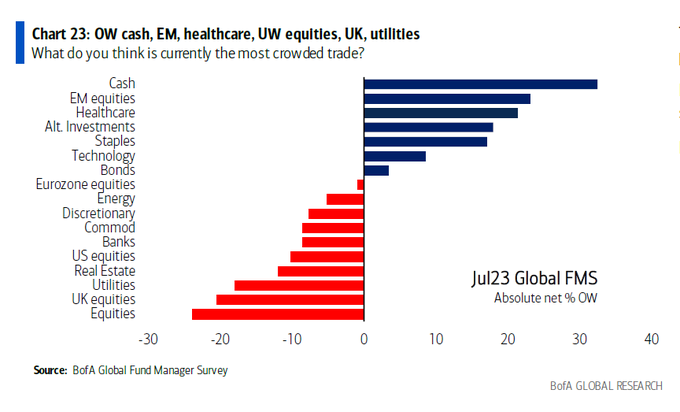
[2] Chart provided by BofA.
Under-owned rallies turn into extended trends. And that’s exactly what’s happened over the last 9 months. Yet, sentiment has been uniquely bearish to go along with the underweight exposure to equities throughout this year:
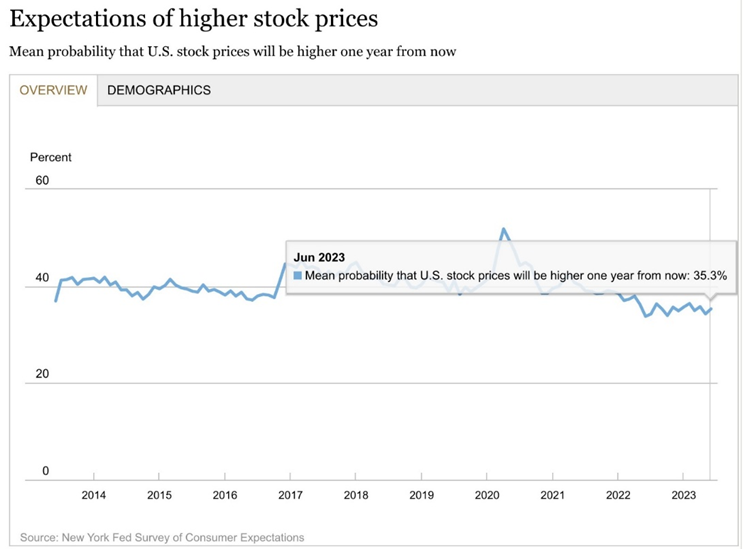
[3] Chart provided by New York Federal Reserve, as of 6/20/2023.

[4] Chart provided by BofA as of 6/30/2023.
[5] In art and design, negative space is the empty space around and between the subject of an image. Negative space may be most evident when the space around a subject, not the subject itself, forms an interesting or artistically relevant shape, and such space occasionally is used to artistic effect as the “real” subject of an image.
But the absence of this hurricane might be the best example of negative space [5] in markets this year. So, what’s (not) happening?
For starters, inflation hasn’t spiraled into a ‘70’s style environment. In fact, the rate of disinflation over the last 12 months has been breathtaking. In June’s CPI print the percent of components of the CPI basket running at a month-over-month increase rate of at least 0.2% was the lowest since 2019. Looking ahead to the second half of the year, we’re likely headed for a stretch of time where the rate of disinflation faces more difficulty maintaining the rate of slowdown in prices. Regardless, the graph below shows an impressive rate of change to the downside for the most talked about (and feared) economic data point of the last year:
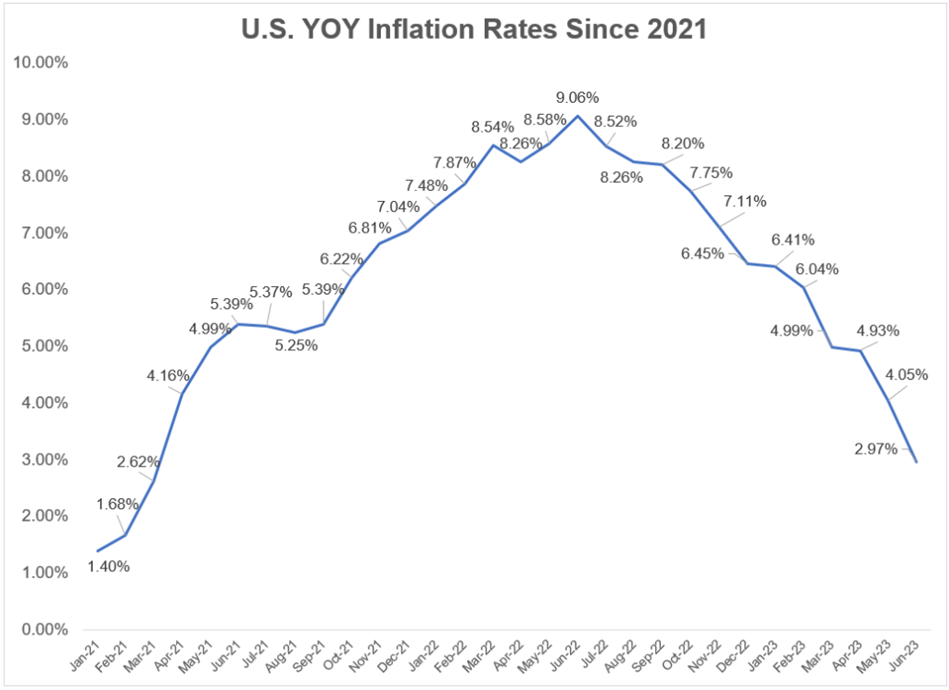
[6] Data provided by Bloomberg database, 6/30/2023
After peaking at more than 9% in June of last year, the latest inflation reading was a hair under 3%. It took 16 months for the inflation rate to go from under 3% to over 9%. It’s taken just 12 months to go from over 9% to under 3%.
What many economists (and investors) would have anticipated in a disinflationary environment like the one above, is a collapse in the labor market. What hasn’t materialized? A slowdown in employment, or in other words an uptick in unemployment. In fact, we have the lowest unemployment figures since 1969:
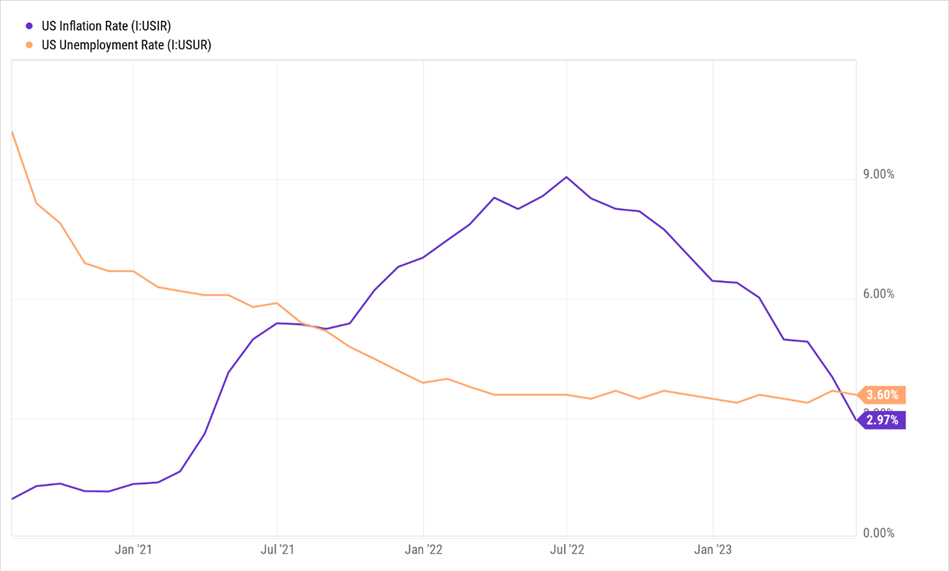
[7] Data provided by YCharts 6/30/2023
Along with the labor market initially expected to finally crack after relentless rate hikes, credit was supposed to dry up. The expectation of a significant slowdown in credit given tighter lending conditions from higher rates, and two of the largest bank failures in history is a pretty logical line to draw to connect the dots. Yet, that hasn’t happened. And to some extent, lending has, but we haven’t seen access to liquidity completely shut down.
Here’s some additional perspective on how to interpret the credit environment:
First, bank lending is a lagging indicator: The growth rate of money loaned out tends to peak when the country is already in a recession and bottom out after a recovery has already started. For all we know, the slowness in bank lending is a response to the slowdown in growth last year and tells us nothing about the future. Second, lending standards on loans for small, medium, and large businesses have been tightening for the past four quarters. But that doesn’t seem to have put a dent in the economy, which has generally performed ahead of expectations during the same period.
This disconnect between lending and the actual performance of the economy could be because the post-pandemic cycle is being driven by higher incomes instead of increasing credit balances. Americans received sizable pay raises and plenty of pandemic stimulus that they could lean on — not needing to charge everything to the credit card. As evidence, bank loans as a percentage of GDP are roughly equal to where it was in 2016, meaning increased debt has not been the driver of activity for roughly seven years.
Maybe the biggest missing piece to the deteriorating economic picture has been the (lack of) collapse in corporate earnings. The earnings that have been reported for the first quarter came in posting negative growth. In fact, the first three months of the year saw the second consecutive quarter of negative profits for U.S. companies. As of the beginning of July, the expectations are for profits to be negative yet again.
But what has kept equities afloat, is that not only did earnings turn out to be less bad in Q1, but revisions for profitability have also been trending higher for several weeks:
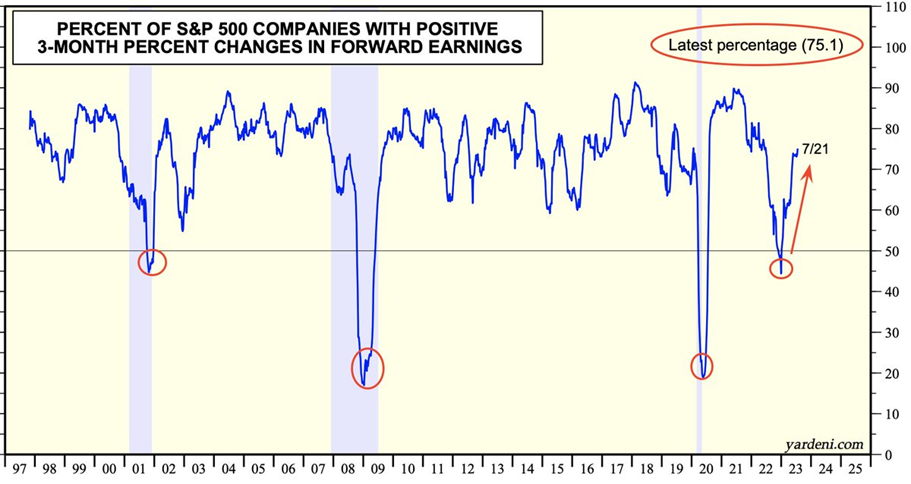
[8] Chart provided by Yardeni Research
So, what happens to an under-owned, largely untrusted move higher in equities? Well, momentum data suggests that the trend is your friend:
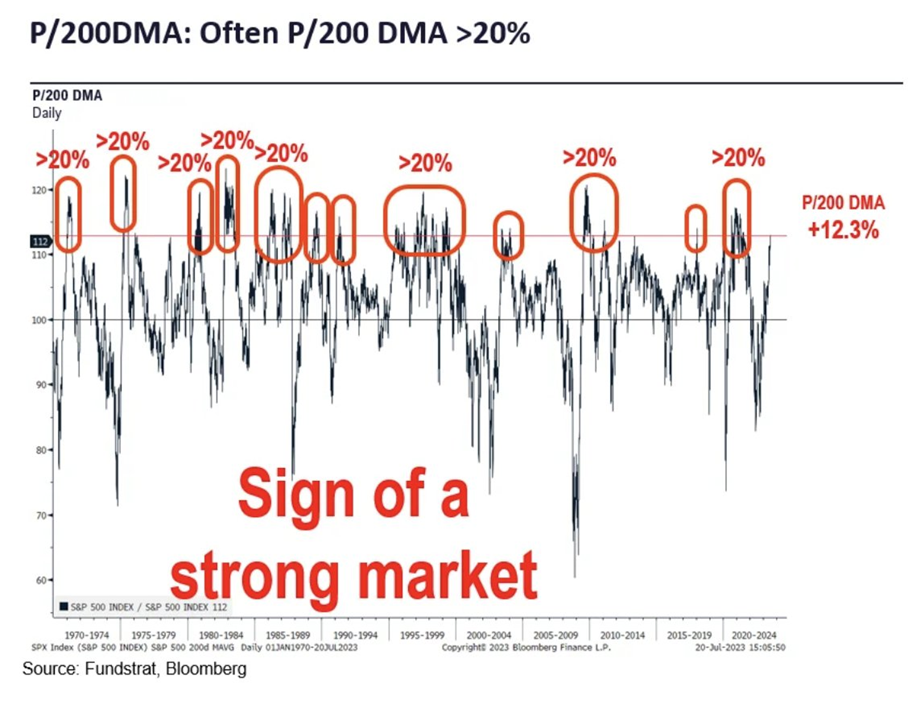
[9] Chart provided by Fundstrat
[10] All data provided by Bloomberg database
Since 1970, on the 12 occasions that the S&P 500 traded at least 12% above its 200 Day Moving Average, 8 of those periods saw the price of the index reach a point 20% above the respective 200 DMA. Today, the market breadth has strengthened to levels that have not been seen for the full duration of this year, or even into the fourth quarter of last. Today, all 11 sectors are above their 200 DMA, which flies in the face of the trope that only 7 stocks have carried the market year-to-date [10].
Less Is More
Fed Chair Powell’s 2022 Jackson Hole speech has a passage that references former Chair Alan Greenspan.
“For all practical purposes, price stability means that expected changes in the average price level are small and gradual enough that they do not materially enter business and household financial decisions.”
This is a clever construct, because it says that a central bank’s real goal is to manage inflation to the point of notional invisibility. This frees up consumers and businesses to focus on other matters, be they savings/consumption trade-offs or hiring/capital investments. Those are more productive endeavors than trying to guess where prices will be in a year, and that was Greenspan’s existential point.
Blending the goal of invisible inflation, and the concept of negative space, we can try and assess what might be (less) needed in order to see continued progress in the fight against inflation.
At the top of the list of what can be removed from the current economic picture is elevated interest rates. There’s a not so crazy idea that the persistence of inflation that has been on display within Core CPI and Core PCE readings is partially driven by higher interest rates. This isn’t completely driven by monetary policy decisions over the last year, but largely influenced by the housing shortage that’s been our reality since the Great Financial Crisis.
The pandemic saw a significant uptick in demand for homes outside of major metropolitan areas, which acted as a spark to the current housing prices we’ve been experiencing. The ability to move about the country was aided by the work from anywhere shift within corporate America, but also because the mobility of owners and renters was quite high thanks to mid-2% 30-year fixed rate mortgages that were available as recently as 2 years ago.
Cheap money, newfound mobility, and a refreshed outlook on life generated a housing boom that has left many on the sidelines trying to purchase their first home with the least affordable housing market on record:
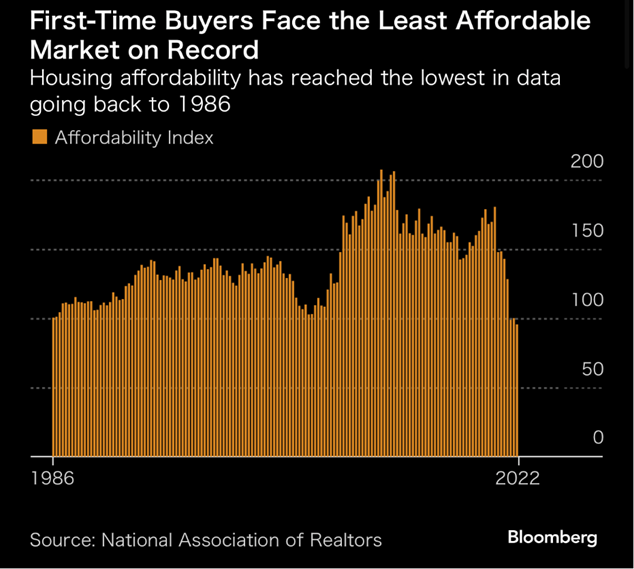
[11] Chart provided by Bloomberg
One of the biggest elements of pressure within the index above is the fact that the quote on a 30-Year fixed rate mortgage is at the highest level we’ve seen since 2000:
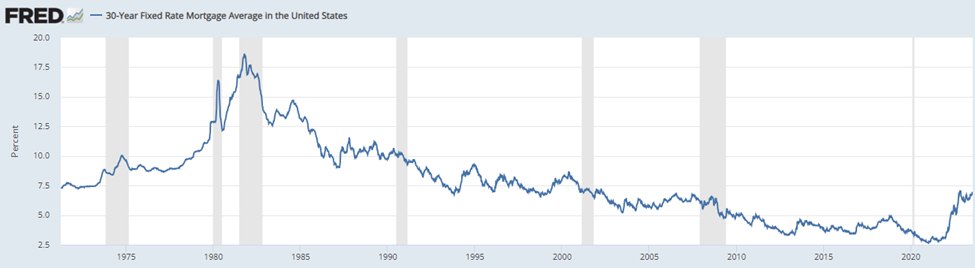
[12] Chart provided by Federal Reserve Economic Database, as of 7/20/2023.
[13] Data provided by the U.S. Bureau of Labor Statistics as of 6/30/2023.
Today, more than 60% of the mortgages held by homeowners are below 4%. Roughly ¼ of mortgages currently held are below 3%. Today, just 1 in 10 mortgages held by homeowners in the United States is as high as 6%.
With no incentive for homeowners to list their homes, the housing shortage stands to inflict immense pain on those looking to contribute to household formation. And given the shortage in housing inventory, the rapid increase in interest rates has contributed to an increase in inflation in one of the biggest ways: Owner’s Equivalent Rent- the single largest contributor to the monthly CPI reports we’ve seen for several months. It accounts for 24% of the basket of CPI inputs, and in the month of June showed an increase of 7.8% on a 12-month basis [13].
The elevated costs to own a home today, combined with the lack of incentive for homeowners to list their existing home for sale, has distorted the demand for rentals and therefore the perceived value of a rental from a property owner’s perspective.
How do you fix it? Cut interest rates. In a perfectly fitting ending to this rate hike cycle, the final blow to the inflation boogeyman may very well be lower rates. FOMC raising rates from these levels not only makes OER look worse, it reduces single-family home supply, makes houses more expensive, but also sends more people into the rental market — making apartment rentals higher. It might sound counterintuitive to many investors, or armchair economists, but let me put it this way:
We just finished more than a decade of near zero interest rates in the U.S., negative rates across the world, and absolutely no inflation to speak of. What’s there to say that a reduction in rates would spur a spike in inflation, specifically driven by OER?
LEGAL STUFF
CURRENT MARKET DATA IS AS OF 7/20/2023. OPINIONS AND PREDICTIONS ARE AS OF 7/20/2023 AND ARE SUBJECT TO CHANGE AT ANY TIME BASED ON MARKET AND OTHER CONDITIONS. NO PREDICTIONS OR FORECASTS CAN BE GUARANTEED. INFORMATION CONTAINED HEREIN HAS BEEN OBTAINED FROM SOURCES BELIEVED TO BE RELIABLE BUT IS NOT GUARANTEED.
THIS PRESENTATION (THE “PRESENTATION”) HAS BEEN PREPARED SOLELY FOR INFORMATION PURPOSES AND IS NOT INTENDED TO BE AN OFFER OR SOLICITATION AND IS BEING FURNISHED SOLELY FOR USE BY CLIENTS AND PROSPECTIVE CLIENTS IN CONSIDERING GFG CAPITAL, LLC (“GFG CAPITAL” OR THE “COMPANY”) AS THEIR INVESTMENT ADVISER. DO NOT USE THE FOREGOING AS THE SOLE BASIS OF INVESTMENT DECISIONS. ALL SOURCES DEEMED RELIABLE HOWEVER GFG CAPITAL ASSUMES NO RESPONSIBILITY FOR ANY INACCURACIES. THE OPINIONS CONTAINED HEREIN ARE NOT RECOMMENDATIONS.
THIS MATERIAL DOES NOT CONSTITUTE A RECOMMENDATION TO BUY OR SELL ANY SPECIFIC SECURITY, PAST PERFORMANCE IS NOT INDICATIVE OF FUTURE RESULTS. INVESTING INVOLVES RISK, INCLUDING THE POSSIBLE LOSS OF A PRINCIPAL INVESTMENT.
INDEX PERFORMANCE IS PRESENTED FOR ILLUSTRATIVE PURPOSES ONLY. DIRECT INVESTMENT CANNOT BE MADE INTO AN INDEX. THE S&P 500 INDEX IS AN UNMANAGED INDEX, WHICH IS WIDELY REGARDED AS THE STANDARD FOR MEASURING THE U.S. STOCK MARKET PERFORMANCE. INVESTMENT IN EQUITIES INVOLVES MORE RISK THAN OTHER SECURITIES AND MAY HAVE THE POTENTIAL FOR HIGHER RETURNS AND GREATER LOSSES.
THE INFORMATION CONTAINED HEREIN HAS BEEN PREPARED TO ASSIST INTERESTED PARTIES IN MAKING THEIR OWN EVALUATION OF GFG CAPITAL AND DOES NOT PURPORT TO CONTAIN ALL OF THE INFORMATION THAT A PROSPECTIVE CLIENT MAY DESIRE. IN ALL CASES, INTERESTED PARTIES SHOULD CONDUCT THEIR OWN INVESTIGATION AND ANALYSIS OF GFG CAPITAL AND THE DATA SET FORTH IN THIS PRESENTATION. FOR A FULL DESCRIPTION OF GFG CAPITAL’S ADVISORY SERVICES AND FEES, PLEASE REFER TO OUR FORM ADV PART 2 DISCLOSURE BROCHURE AVAILABLE BY REQUEST OR AT THE FOLLOWING WEBSITE: HTTP://WWW.ADVISERINFO.SEC.GOV/.
ALL COMMUNICATIONS, INQUIRIES AND REQUESTS FOR INFORMATION RELATING TO THIS PRESENTATION SHOULD BE ADDRESSED TO GFG CAPITAL AT 305-810-6500.