

The first quarter of 2023 went out with a bang. When the Federal Reserve embarked on its rate hiking cycle 12 months ago, not many market participants expected to see the Fed Funds Rate end up at 5% in the 12 months that followed. But as we saw policy steamroll its way to 5%, and potentially beyond, the growing chorus of “something’s gotta give” only grew louder. Many individuals (me included) were pointing to the housing market as the likely first thing to break. But as we learned in the first quarter of this year, it was the regional banking industry that threw up the white flag. The first quarter of the year was capped off by the second largest banking failure in U.S. history, and the first bank run in the digital age. But what looked like the beginning of a systemic financial crisis, has seemed to turn out to be more of a tremor. The last 6 or 7 months have seen a string of cautious and some even downright troubling signals for the economy. Yet, the first quarter was a continuation of the relief in asset prices that began 3 months prior. What exactly is someone to make of this juxtaposition? Here’s the data we are focusing on to try and remain as present, and objective about the markets are possible.
Bend, Don’t Break
This is the theme we think the market and economy have adopted through the first three months of the year. ‘Bend don’t break,’ an expression adopted by NFL teams when describing a defense that might allow for an opposing team to rack up a large number of yards on offense, but limits how many points scored against them. A ‘bend don’t break’ defense can win you a Super Bowl (2021 Rams), so long as you have an offense and special teams that can find their way to the endzone and win the battle of field position.
Layoffs, persistent inflation, weaker corporate earnings, negative real wage growth, and rate hikes up to our eyeballs. The economic machine has had a lot thrown at it, and nevertheless, she persisted. Like a defensive secondary unit anchored by Deion Sanders, facing a pass-happy offense with Patrick Mahomes behind center. But so far, the goal line defense has been the equalizer. So, as we begin to assess the data from the first quarter of the year, the first place we need to focus on is corporate earnings.
The final two quarters of 2022 saw consecutive quarters of negative earnings growth, triggering what’s known as an earnings recession. Excluding energy, the S&P 500 actually saw three consecutive quarters of negative earnings growth in 2022. In fact, backing out the energy sector, the full calendar year saw a dip in corporate profits of -7% [1]. So, as we face the first quarter’s earnings season, concerns for U.S. corporate profits are accruing at a faster rate than the actual losses, now that we’ve seen energy prices stabilize significantly.
[1] Data provided by Bloomberg database.
[2] Chart provided by BMO, data provided by Factset. Data through 2022.
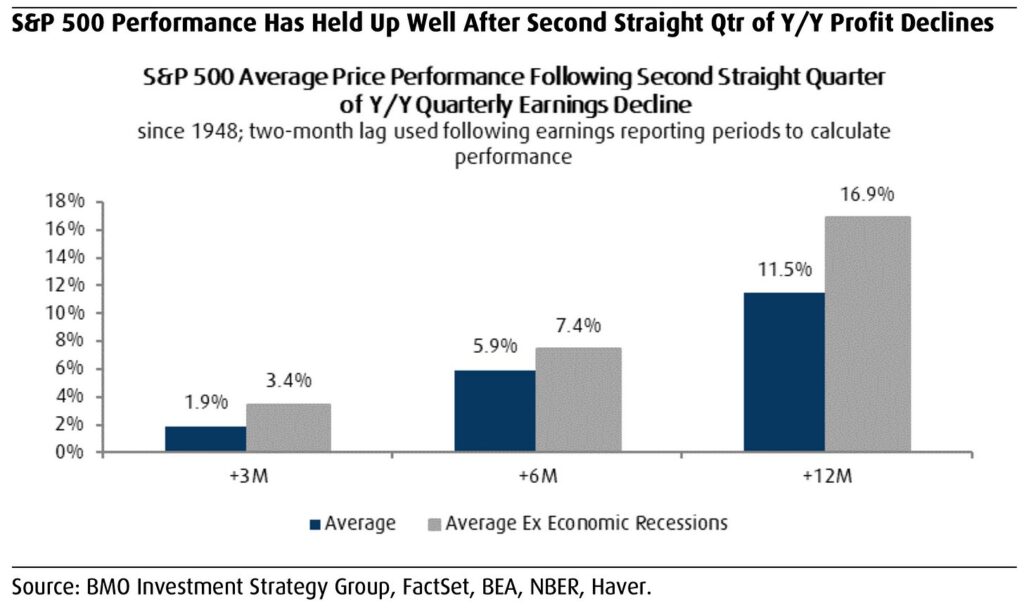
According to data and research at BMO, during the 16 profit recessions since 1948, the S&P 500 rose 5.9%, on average in the six months after the second consecutive y/y earnings decline with gains occurring 75% of the time. The average price return improved to 7.4% when stripping out periods when an economic recession also occurred. Gains were also common throughout the duration of these earnings recessions with the S&P 500 only posting losses four times, and the average annualized price return being 21.7% [3].
Furthermore, in 4 of the last 7 earnings recession, the U.S. economy did not enter an economic contraction. The last time we saw an extended period of poor corporate profitability, and more importantly an extended period of negative expectations for profits, was the period from summer 2015 through spring of 2016. The S&P 500 traded in a sideways range of ~15% before resuming its march higher in the fourth quarter in 2016- the first quarter in a nearly 2-year stretch where earnings growth was expected to be positive in the next quarter [4].
As the earnings season for Q1’23 kicks off, we can see that expectations are still pretty tempered for companies’ bottom line through the first three quarters of the year:
[3] Data provided by BMO.
[4] Data provided by Bloomberg database.
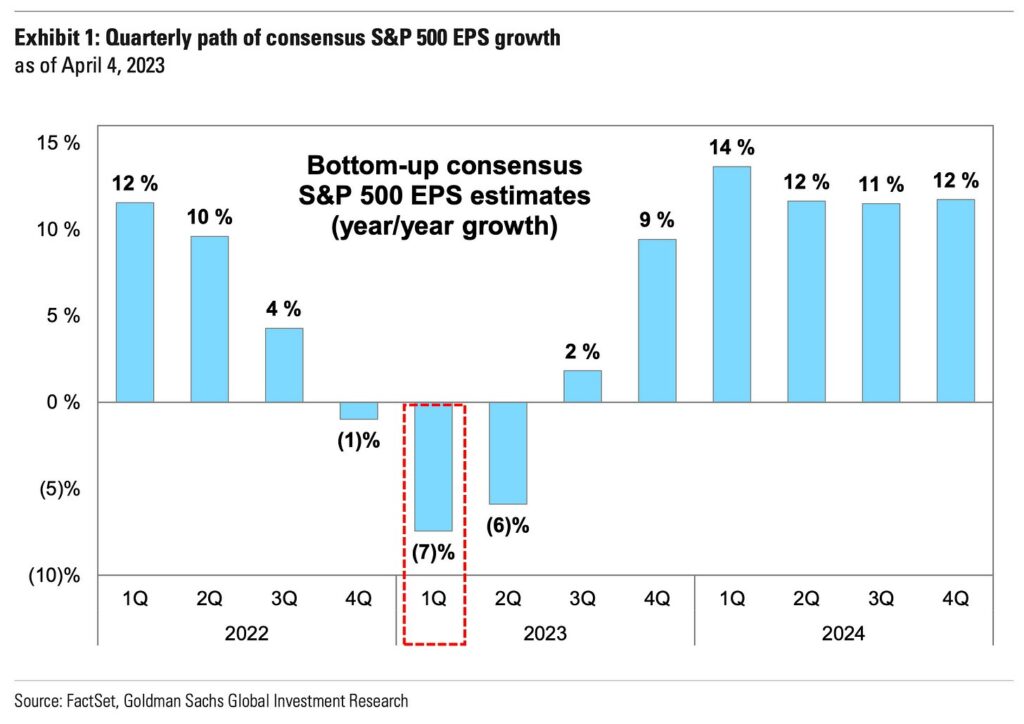
[5] Chart provided by Goldman Sachs; data provided by Factset.
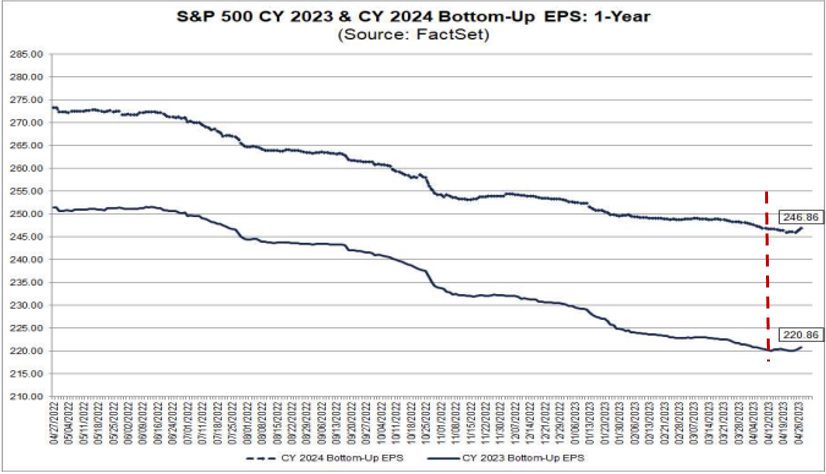
Estimates for this year’s earnings total have continued to come down over the last twelve months, and even through the first 3 ½ months of the year. But what’s worth noting is the estimates for 2024 seemed to have taken a brief break from moving lower in tandem. In the chart below, the dashed line on the top represents 2023 EPS estimates, the bottom solid line represents estimates for 2024[6]:
[6] Data provided by Factset.
[7] Chart provided by Factset.
One of the major forces driving the expectations lower for earnings (both currently, and last year) is the fact that margins have compressed for 5 straight quarters on the index level. And for the first quarter of this year, the expectations are that this trend isn’t completely done. Margins drive the medium and long-run earnings power for a company. This is largely why you’ve seen the “year of efficiency” be adopted as a mantra by corporate executives.
The downside to this is that, unless margins halt their skid in the coming 180 days, the rosy outlook for Q4 this year and potentially next year is still largely in question. The bright side is that despite the compression we’ve seen for nearly a year and a half, the current level of S&P net margins of 11% (analysts’ Q1 2023 estimate) is actually equal to the prior decade’s (2010 – 2019) highs. If this can hold, then profitability in the next economic expansion (that’s a big if with a lot of unknowns surrounding it) stands a chance to reach the pre-pandemic highs of 13% margins, or even greater. That’s the upside to financial leverage and post recessionary booms.
King D
A story across the market that’s garnered quite a bit of attention in the first quarter of the year was the downfall of the U.S. dollar. One of risk assets’, specifically equities, biggest headwinds in 2022 was the strength of the dollar– life comes at you fast. Largely in part due to the speed of monetary policy in the United States compared to central banks across the globe. Generally speaking, when one currency is tied to a monetary policy regime that is outpacing its peers in tightening, the higher yielding currency tends to strengthen. But, as those other monetary policy regimes begin to catch up, the flow of capital tends to seek out the new shiny object. This is the cyclical nature of currency markets.
A look at the chart for the dollar index can illustrate some of this shift in policy and therefore appetite for global investors as of late:
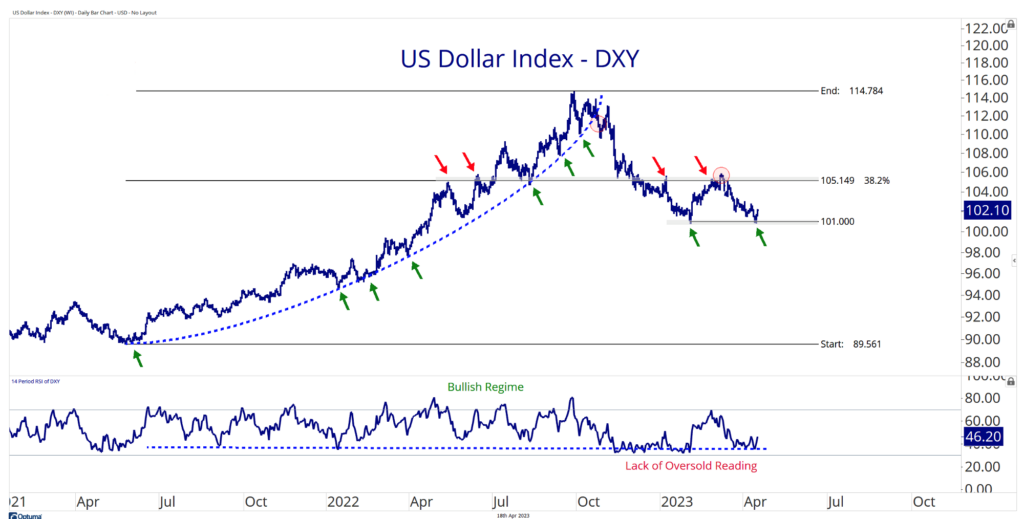
[8] Chart provided by AllStar Charts, as of 4/18/2023.
The ascension higher for the dollar really picked up steam in the spring of last year when it was evident that the Federal Reserve was beginning to hike more aggressively. It also doesn’t hurt that the dollar tends to act as a safe haven asset in times of crisis. And we’re just over a year past the invasion of Ukraine.
The conversation surrounding the dollar, and its potential downfall as the reserve currency, seems conveniently timed right around a recent visit to all-time highs for the DXY. It seems to me that some people are trying to use recent dollar weakness, due to an expectation for a softer stance from the Fed, as a trojan horse for more conspiratorial beliefs on the global currency market.
So, let’s unpack this for a moment.
Three things would have to happen for the USD to lose its reserve currency status in the global economy:
Another currency would have to take its place. i.e., the Chinese yuan. For this to happen, the yuan would have to be open, stable, and transparent. China would have to improve corporate governance and produce constant economic and financial information and relax policies around capital controls. Basically, do a lot of things they resist.
Entire economic structures would have to change. China would have to shift from a deficit economy to a surplus economy. The US runs a trade deficit to support dollar dominance- which does have a cost of absorbing surplus from economies like Russia and China, so everything is symbiotic. China gets to run an export-oriented economy because its stockpile of dollars stabilizes the yuan. That wouldn’t be able to happen anymore.
The US would have to end dollar dominance themselves. This would be accomplished by doing something dumb like…defaulting on their debt.
Some people like to say we need to return to gold or adopt cryptocurrencies. But the reality is commodities are volatile, and crypto currencies are still largely a speculative corner of the internet. Being the reserve currency is a big responsibility for a country to take on. They need to absorb the imbalances of the world. They need flexible, liquid, financial markets. Stable and transparent governance, and it helps to have a global military presence with bases across the world. People have been trying to kill the dollar for decades- and yet, there isn’t much to show for it. The dollar still makes up 90% of all foreign exchange transactions, and there’s over $2Trillion USD in circulation[9]– with half of those located outside the US. You can’t exactly just erase that one day. There’s no legitimate alternative to the dollar. It’s the safe haven currency/asset when things get hairy, like we just saw for the past three years when the dollar marched to record highs through the entire cycle of the pandemic (see above). It’s not as simple as countries just deciding not to use the dollar. It took ten years in the fifties for the dollar to surpass the British pound as the global currency. And the pound held on for another 10 years after that before flatlining[10]. Markets move exceptionally fast- but not the currency market.
[9] Data provided by Bloomberg database, IMF.
[10] Data provided by Bloomberg database.
Resiliency
With the backdrop we’ve been operating within for the last few months, many investors have been left puzzled. Through the first 100 or so days of the year, the S&P 500 has climbed by more than 7%. The index is roughly 13% off its all-time high, and about 18% off the lows it was trading at in the middle of October last year [11]. A bit of a no man’s land.
A string of consecutive 75 basis point hikes last year and the prospect of a couple more 25bp moves to come before Labor Day, would have convinced most market participants to believe that the economy wouldn’t be able to tolerate such a violent move higher in interest rates. We’d been conditioned to believe the economy couldn’t handle higher rates due to the size of the debt on the country and corporate balance sheets. We’ve also been told for the better half of a decade that the “natural rate of interest” was something close to 2-2.25%. And at one point, some policy makers believed this equilibrium rate might be below 2%.
But as it turns out, this was the wrong school of thought.
There’s a lot that remains unknown regarding the current environment, but I think it is fair to say that when it comes to the natural rate of interest that the U.S. economy is able to tolerate, it is indeed higher than previously expected. Which means what we thought the economic damage that was originally pontificated could arise from a 500bps increase in interest rate hikes, is not quite what we thought it would have been. Perhaps to reach the havoc that was envisioned, this economy would need to have 600-700bps in hikes.
It’s clear that demand has held up despite the regime we’ve seen over the last year. So, when we look at credit spreads that haven’t blown out (even CCC debt), or consumers who are not over-levered, or an equity market that’s rallied by nearly 20% from its 2022 lows; we should perhaps take a second to reassess what our preconceived bias was making us believe what this reality would look like. Here’s the profitability of the S&P 500:
[11] Data provided by Bloomberg database.
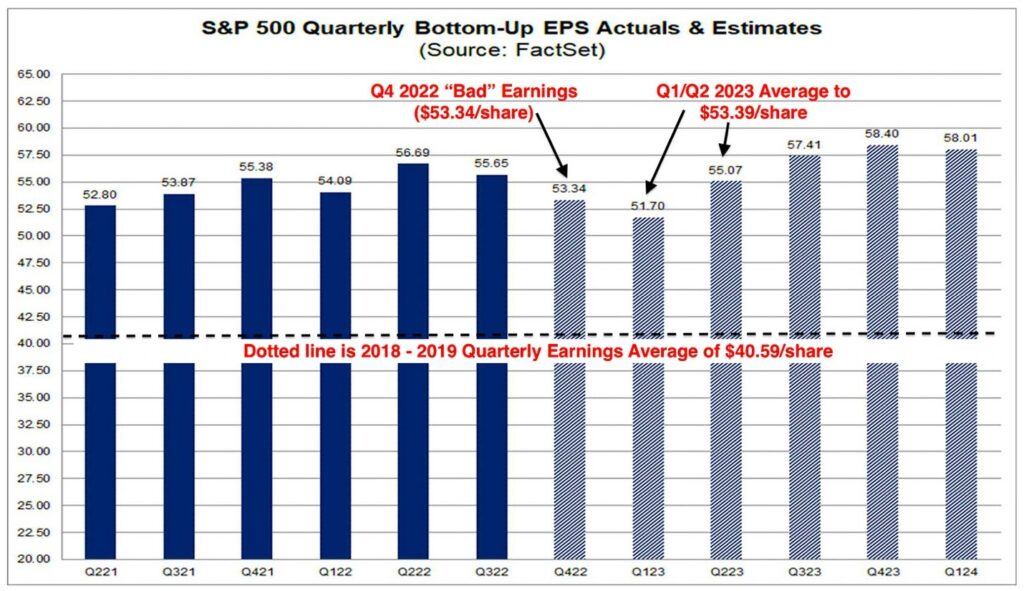
[12] Chart provided by DataTrek, data provided by Factset.
Despite the earnings weakness we’ve noted above, the level of profitability for companies today is about 30% above the level in the year preceding the pandemic. So, investors shouldn’t be dumbfounded as to why the S&P 500 is about 35% higher than where it was 4 years ago.
Sentiment isn’t everything, but price certainly is.
LEGAL STUFF
CURRENT MARKET DATA IS AS OF 4/20/2023. OPINIONS AND PREDICTIONS ARE AS OF 4/20/2023 AND ARE SUBJECT TO CHANGE AT ANY TIME BASED ON MARKET AND OTHER CONDITIONS. NO PREDICTIONS OR FORECASTS CAN BE GUARANTEED. INFORMATION CONTAINED HEREIN HAS BEEN OBTAINED FROM SOURCES BELIEVED TO BE RELIABLE BUT IS NOT GUARANTEED.
THIS PRESENTATION (THE “PRESENTATION”) HAS BEEN PREPARED SOLELY FOR INFORMATION PURPOSES AND IS NOT INTENDED TO BE AN OFFER OR SOLICITATION AND IS BEING FURNISHED SOLELY FOR USE BY CLIENTS AND PROSPECTIVE CLIENTS IN CONSIDERING GFG CAPITAL, LLC (“GFG CAPITAL” OR THE “COMPANY”) AS THEIR INVESTMENT ADVISER. DO NOT USE THE FOREGOING AS THE SOLE BASIS OF INVESTMENT DECISIONS. ALL SOURCES DEEMED RELIABLE HOWEVER GFG CAPITAL ASSUMES NO RESPONSIBILITY FOR ANY INACCURACIES. THE OPINIONS CONTAINED HEREIN ARE NOT RECOMMENDATIONS.
THIS MATERIAL DOES NOT CONSTITUTE A RECOMMENDATION TO BUY OR SELL ANY SPECIFIC SECURITY, PAST PERFORMANCE IS NOT INDICATIVE OF FUTURE RESULTS. INVESTING INVOLVES RISK, INCLUDING THE POSSIBLE LOSS OF A PRINCIPAL INVESTMENT.
INDEX PERFORMANCE IS PRESENTED FOR ILLUSTRATIVE PURPOSES ONLY. DIRECT INVESTMENT CANNOT BE MADE INTO AN INDEX. THE S&P 500 INDEX IS AN UNMANAGED INDEX, WHICH IS WIDELY REGARDED AS THE STANDARD FOR MEASURING THE U.S. STOCK MARKET PERFORMANCE. INVESTMENT IN EQUITIES INVOLVES MORE RISK THAN OTHER SECURITIES AND MAY HAVE THE POTENTIAL FOR HIGHER RETURNS AND GREATER LOSSES.
THE INFORMATION CONTAINED HEREIN HAS BEEN PREPARED TO ASSIST INTERESTED PARTIES IN MAKING THEIR OWN EVALUATION OF GFG CAPITAL AND DOES NOT PURPORT TO CONTAIN ALL OF THE INFORMATION THAT A PROSPECTIVE CLIENT MAY DESIRE. IN ALL CASES, INTERESTED PARTIES SHOULD CONDUCT THEIR OWN INVESTIGATION AND ANALYSIS OF GFG CAPITAL AND THE DATA SET FORTH IN THIS PRESENTATION. FOR A FULL DESCRIPTION OF GFG CAPITAL’S ADVISORY SERVICES AND FEES, PLEASE REFER TO OUR FORM ADV PART 2 DISCLOSURE BROCHURE AVAILABLE BY REQUEST OR AT THE FOLLOWING WEBSITE: HTTP://WWW.ADVISERINFO.SEC.GOV/.
ALL COMMUNICATIONS, INQUIRIES AND REQUESTS FOR INFORMATION RELATING TO THIS PRESENTATION SHOULD BE ADDRESSED TO GFG CAPITAL AT 305-810-6500.