

“Congress shall make no law respecting an establishment of religion, or prohibiting the free exercise thereof; or abridging the freedom of speech, or of the press; or the right of the people peaceably to assemble, and to petition the government for a redress of grievances.” James Madison wasted no time putting the people on notice. ‘Carry on in your personal life, the government won’t interject itself into your day to day restricting how you speak or think.’ Overtly, anyway. As much as separation of church and state has been deeply engrained in our DNA as Americans since the jump, we think the first amendment stands to be, well, amended. How’s this: “Investors shall make no attempt to mix their partisan affiliation and their portfolio, especially in an election year.” Separation of party and portfolio has long been our mantra. With the midterm elections upon us, we’d like to take a second to remind investors of this once again.
LEADERSHIP MATTERS…RIGHT?
It’s natural for investors to see elections as events with significant and material implications for markets, economies and the societies we live in. While on paper it would seem like a pretty straight forward arithmetic exercise, but in reality, it’s a bit more nuanced than that. Excuse us for breaking our own rule about noise for a second. But hopefully you’ll see just how many different ways one can perceive an issue and there not be a clear cut angle to take.
Midterm elections naturally aren’t significant macro events the way general elections are. They’re a bit more of a political show from the perspective of investors. (However, we couldn’t stress the importance of voting enough. If you need help figuring out how, click here.) What’s at stake here is, will you continue to see a unified governing power in Washington, or will we revert back to a gridlock split government body, the way we’ve seen the vast majority of the time? In a few hours we’ll have an answer to that question, and then a laundry list of questions for each possible outcome. But let’s take a look as to why, historically, investors shouldn’t concern themselves with one result over another.
FIRST, THE MARKETS
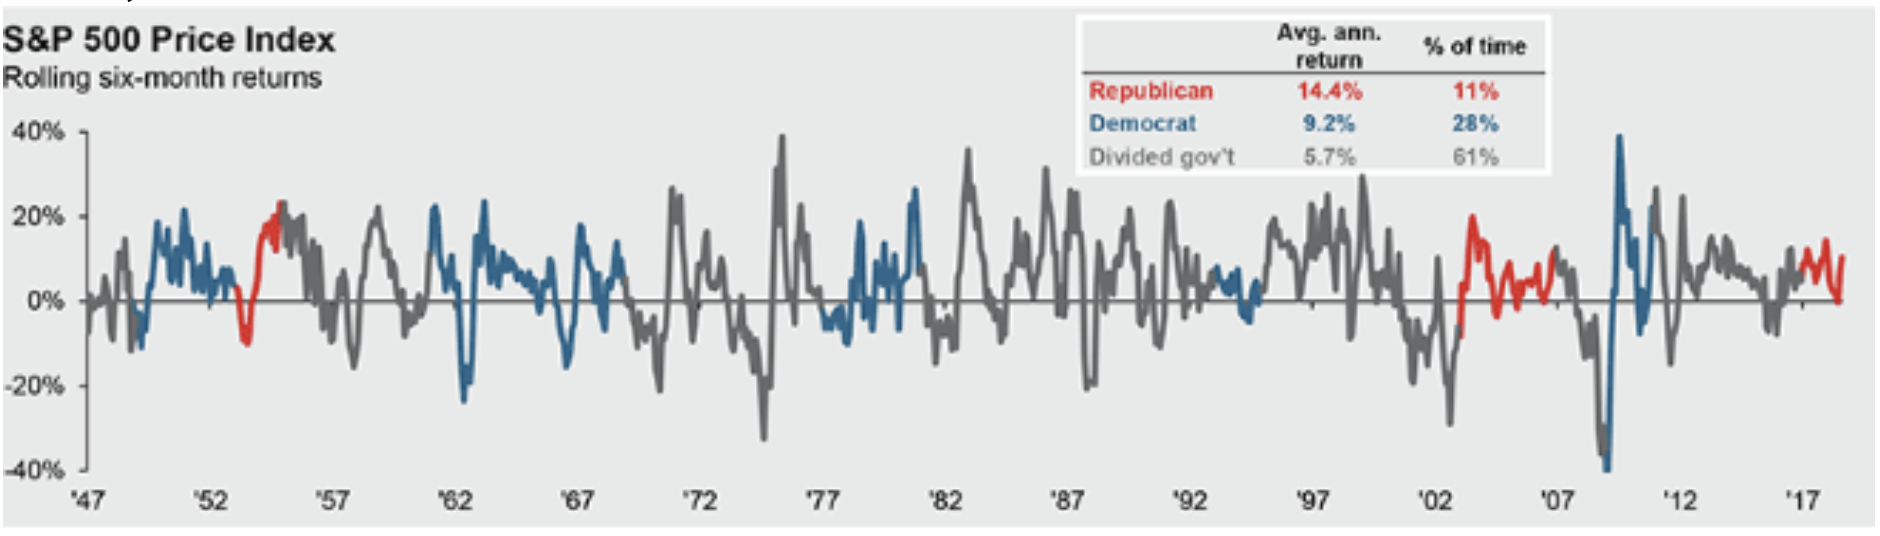
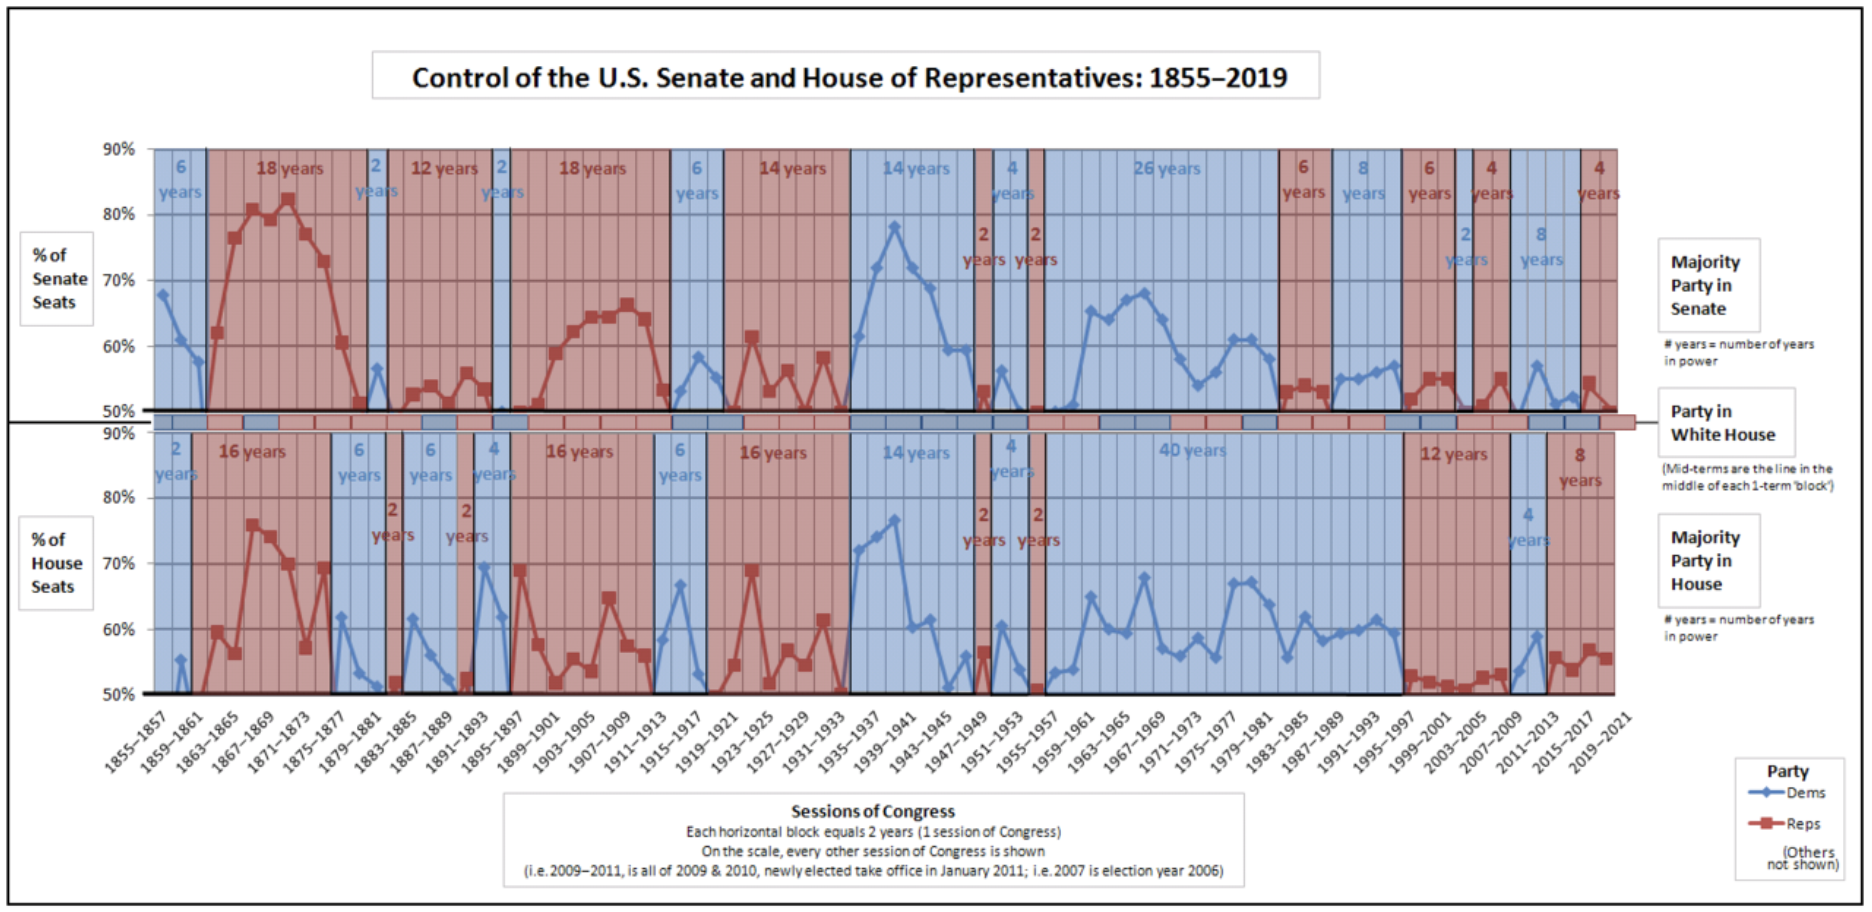
We spend the majority of the time (61 percent) with a gridlocked governing body1. Even with the struggle this breeds from a policy standpoint from time to time, equity returns have still historically been positive, albeit slightly below the long-term average annualized return. Do we think the returns of equities in these periods are a direct result of the indecision that comes from Capitol Hill? Obviously not. But we’ll check the box of it not leading to poor U.S. equity returns and move on to the next point of concern.
Recent media coverage has somewhat successfully delivered the message of the so called “Blue Wave” potentially spelling disaster for the economic expansion and the markets. The year has seen no shortage of volatility catalyst, but judging by the evidence beautifully illustrated by J.P. Morgan above, we don’t really buy the split government a Blue Wave would bring a risk. In fact, the last time we went through a midterm election cycle (2014) we were in an eerily similar environment. We were fresh off a post-general election, year-long rally (2013) and were experiencing skirmishes of volatility. Don’t take our word for it, just look below. Here is the S&P 500 in 2014 leading up to and through the mid-terms vs the S&P YTD through November 1 this year: 2
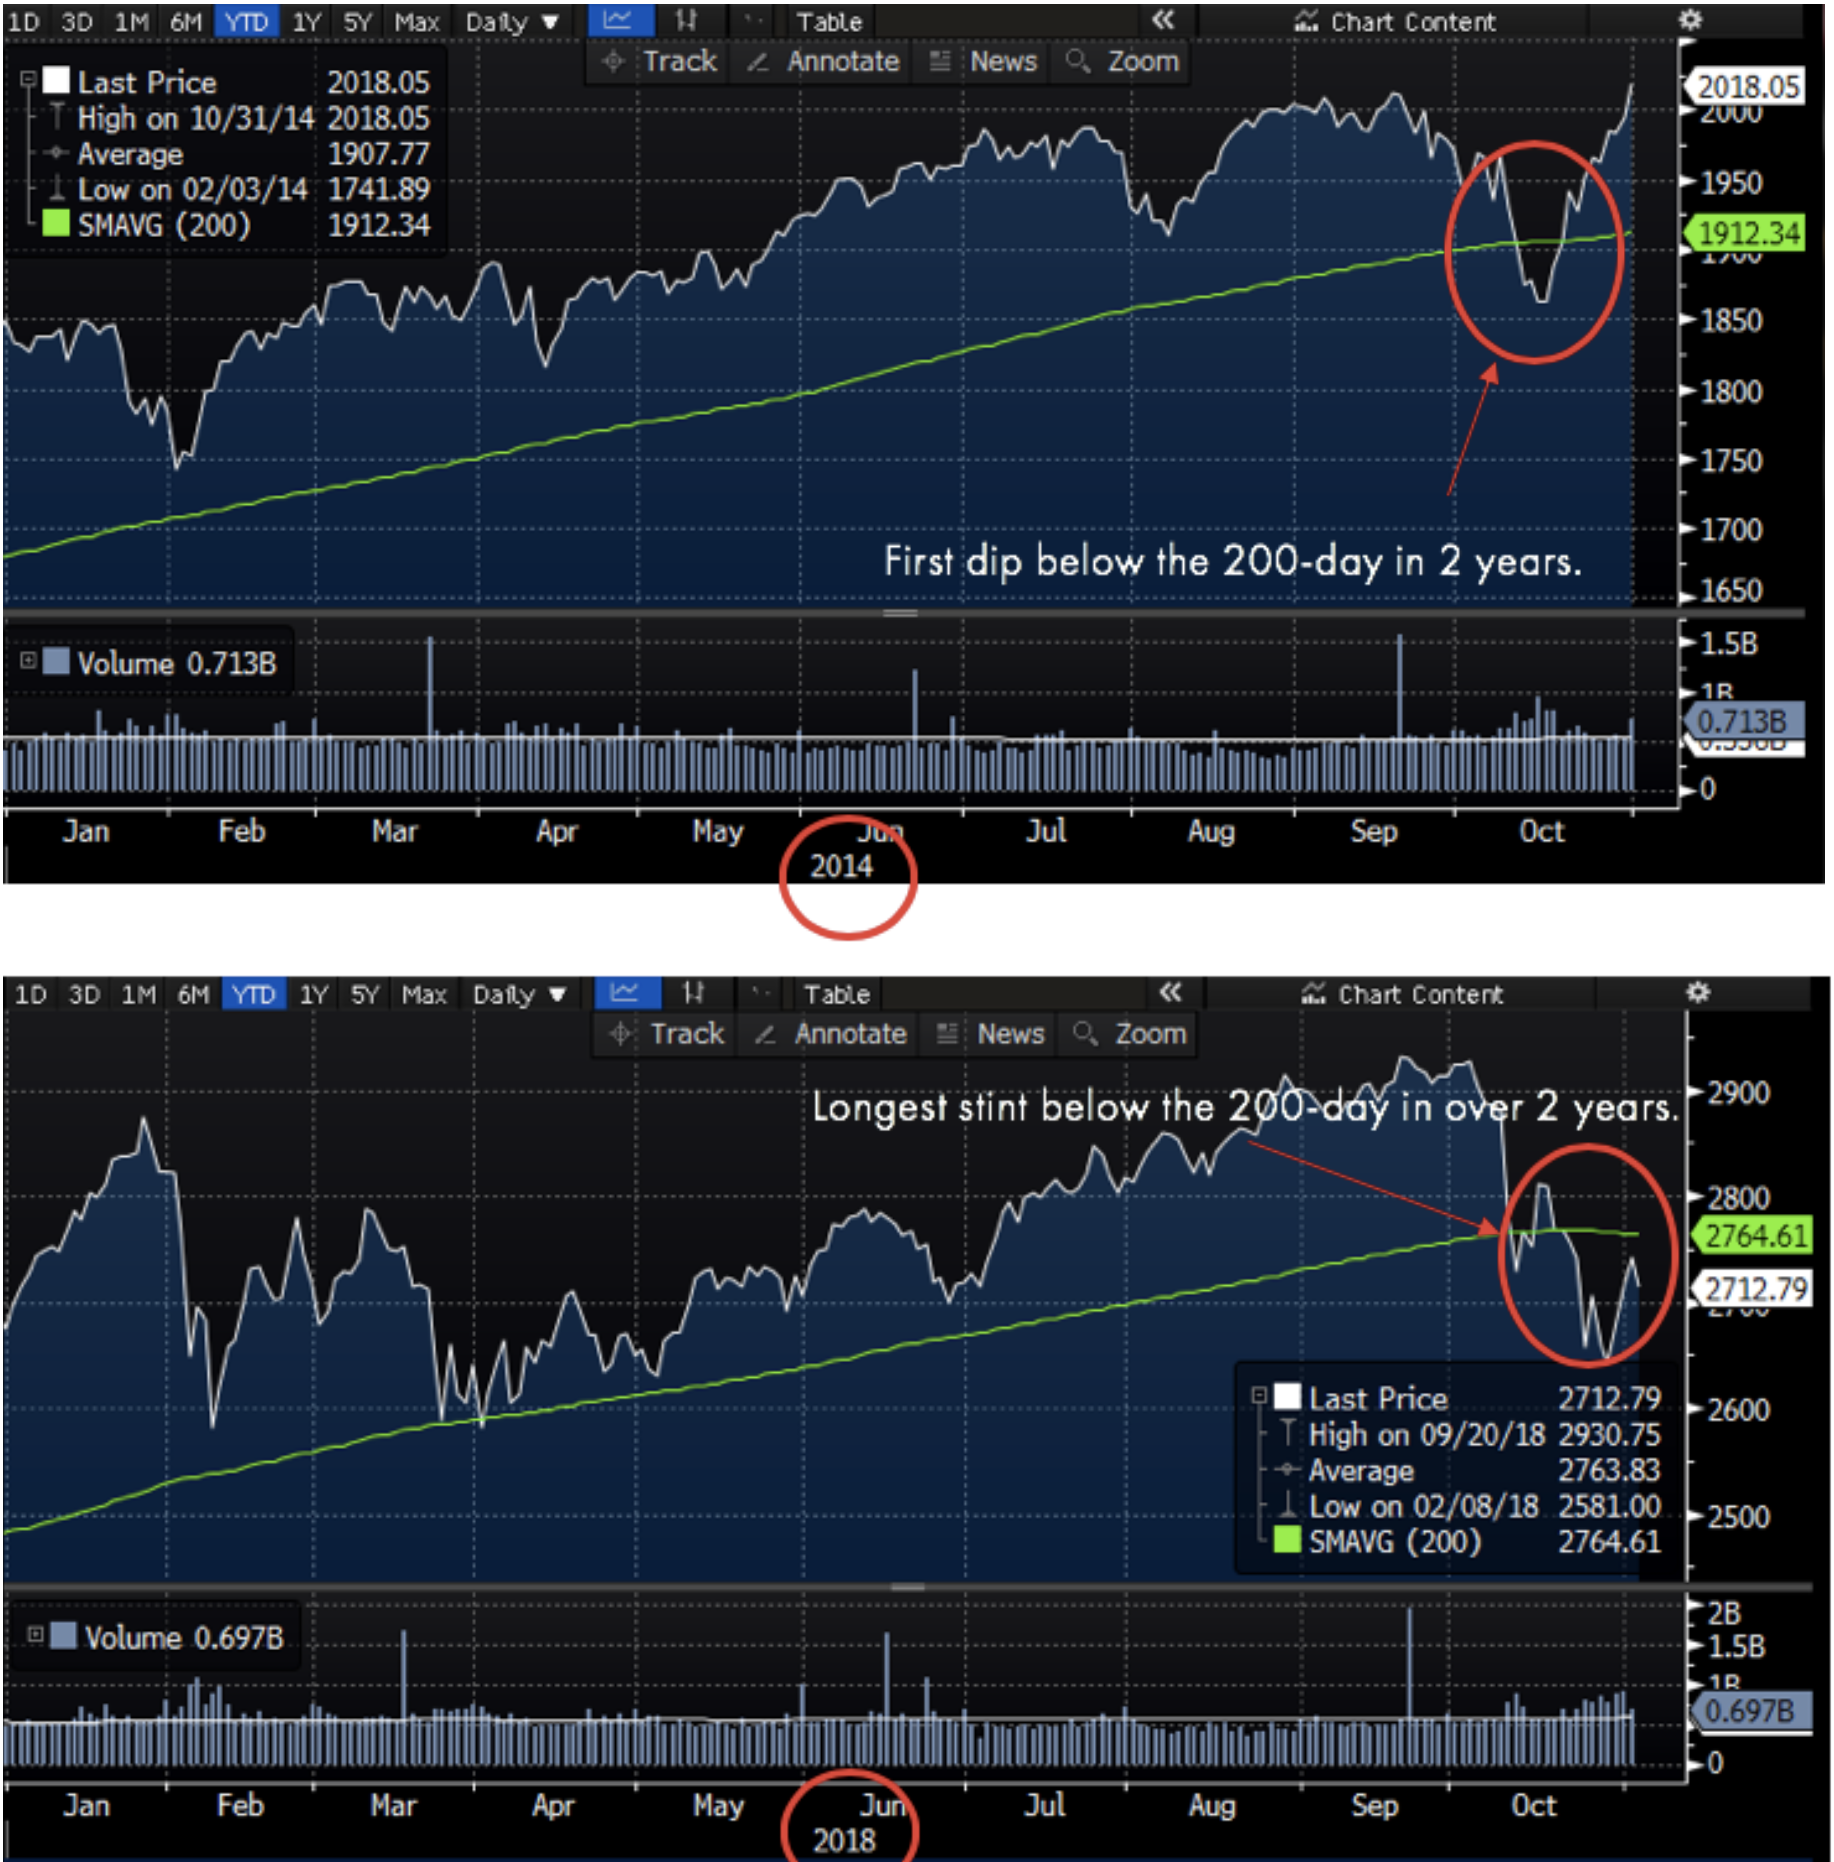
Four years ago, that breach of the moving average not only seemed foreign, but Earth stopping. Today, much of the same sentiment can be felt across the market. Do we think it’s because of the mid-terms? No. We think investors will be largely happy to see November 6 come and go. Almost as excited for this past October to end. The takeaway should be that the current price action heading into the election shouldn’t be perceived as anticipation of the party coming to an end for the market.
NEXT, THE ECONOMIC MACHINE
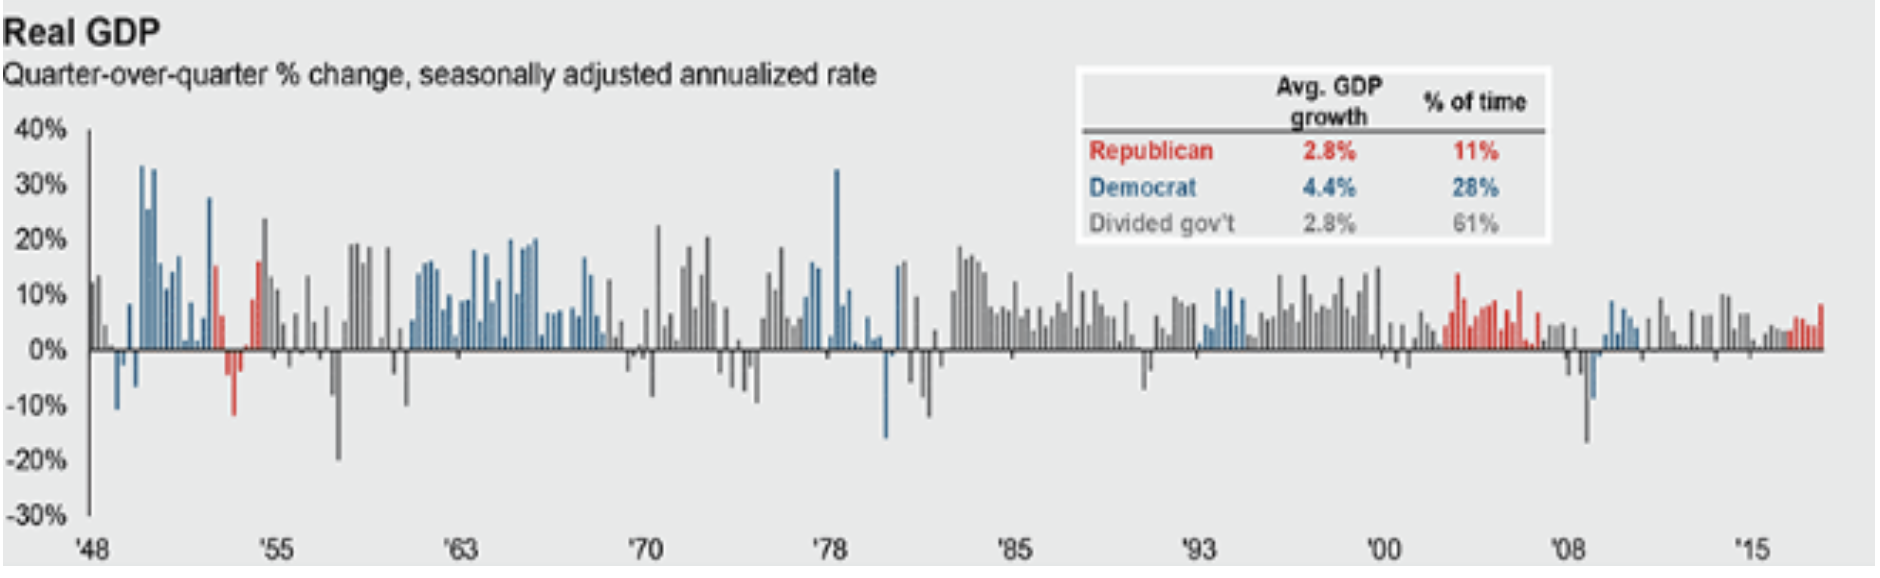
The economic system that we rely on will forever be much larger than one person, for better or for worse, in spite of the fact it being made up of us all as a whole. But the impact of who is at the helm for policy decisions might actually have some bearing on how the economy performs. (Wait let us check…yea just maybe.) Keeping in mind that the economy is about 66 percent consumer driven, policy decisions and how the government spends their money still matters. Similar to the historical party distribution chart noted above, the one below shows GDP growth over the same period. Obviously we see the same distribution of partisan power. Similar to how we see Republican control aligning with higher equity returns, here we see Democratic control associated with higher GDP growth 3. By now you see who the preferred party is, right? Yea neither do we.
TRACK RECORD OF RED
While some have been busy trying to sell the potential downfall of a predominantly blue House; where there does lie some interesting evidence is on the opposite end of that argument. We’ve seen an all-Republican ruling government for the last two years (+/-). What has history looked like when we’ve seen an echo chamber of Republicans in the halls of D.C.?
Well, the three times since 1900 that the country has seen a unified Republican Government last longer than one Presidential cycle (see below) we’ve seen some notable financial crises:4
- There was the Knickerbacker Crisis of 1907 (not this one, this one) where the U.S. stock market declined by 50 percent in just three weeks in the midst of an economic recession. Bank runs were so out of control that regional and trust banks went bankrupt. The spark that led to this financial collapse was a failed bid by United Copper who was attempting to gain significant market share. Their bid was funded by loans from some of the nation’s largest banks. One of which being Knickerbacker Trust. If it weren’t for J.P. Morgan (the man, not the bank) stepping in and pledging his own funds (not even Bezos could do that today) to support the system this crisis could have been much, much worse. Fun fact: this led to the Federal Reserve system we use today.
- Then there’s the Great Depression, which began in 1929 following nearly a decade of a unified Republican Government creating policy (or lack thereof) in the twenties. The Depression was exacerbated by a global trade war. Imagine that.
- Finally, the Great Financial Crisis in 2007/2008 (the names have admittedly gotten worse over time). Loose regulation on the banking system and a false sense of wealth from the consumer for the better part of a decade helped paint the worst economic picture in 75 years.
WHAT’S IN STORE?
Well, hopefully by now you’ve caught on it doesn’t necessarily matter for the markets (especially in the immediate-term) what the outcome of this year’s midterms are. History hasn’t shown a meaningful difference in asset returns, and we spend the majority of the time with indecisiveness coming from D.C.
We aren’t even interested in wasting your time telling you about the historical rally that leads into and brings us out of midterm election cycles. Because, even like the data we shared here that does not have arbitrary bookends attached to it, we don’t think the midterms have the significance to carry causation when it comes to asset behavior. Scape goat? Sure. Reason for a rally, or potential sell off? Nah.
Do we think that one party is solely responsible for the economic mishaps, or leading the nation into difficult geopolitical scenarios? No. Those points easily identifiable in history are solely the pinnacle of a culmination of human behavior on both sides of the aisle. Which is why, once again, separation of party and portfolio should be added to the First Amendment of the Bill of Rights.
Thank you for coming to our Ted Talk. Go vote.
Sources:
1 Chart provided by J.P. Morgan
2. Bloomberg
3 Chart provided by J.P. Morgan
4. About.com, Bloomberg, Wikipedia
5 The Signal and the Noise, Nate Silver