Market Outlook 2022
In the depths of the pandemic in the spring of 2020, our “market call” was to be long humanity. We took a look at history and understood that it was at the darkest hours when human ingenuity broke through to continue the progression of society forward. The mRNA vaccine proved to be our moment of break through and 2021 saw some sort of semblance of normalcy because of it. The continuation of our “trade” to be long humanity ultimately is our biggest market call for 2022 (you might recall, we’re not big into forecasting). As we’ve seen broader adoption of vaccination, an increasing amount of therapeutics and despite a revolving door of new strains (albeit, slightly less powerful); we believe 2022 will see the official end of the COVID-19 pandemic. We anticipate a full global recovery in terms of economic and societal conditions. This would result in a strong cyclical recovery, a return of global mobility, and a release of pent-up demand from consumers (e.g., travel, services) and corporates (inventory, capex, and buyback recovery).
Here are some of our views on the biggest themes of the market today:
A New Age Tightening Cycle
Let us set the stage for the economy in the next twelve months in order to try to best interpret what the Treasury market will be up against- in our view the most influential variable for multi asset class portfolios in the coming 24 months.
We see reason to forecast relatively broad-based strength. First, with household balance sheets in robust shape as a function of excess savings and rising asset prices, this sets the stage for a continuation of strong spending, aided by furthered gains in labor income. Second, corporates are in relatively strong shape, and we see business investment rising. Finally, government is a source of strength in this environment, and we see federal spending continuing to rise through 2022 (with the caveat of stonewalling coming into the Mid-term elections). On balance, this leaves an economy that looks quite resilient, and because of that, we see the labor markets continuing to tighten rapidly and continued above trend economic growth in 2022.
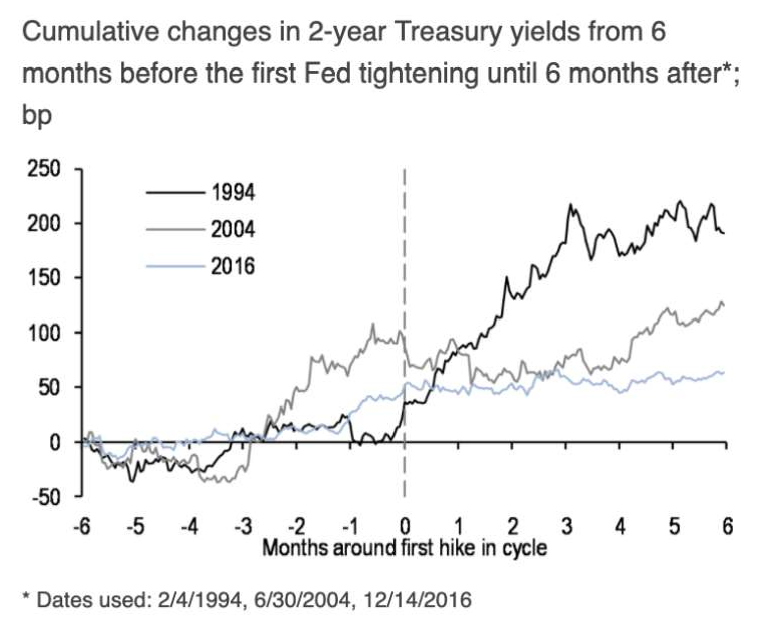
Given this backdrop, we think it’s worthwhile to review the behavior of the Treasury market in prior tightening cycles, because historical performance can help inform our expectations into 2022. We would argue there have been three significant tightening cycles over the last three decades 1994-1995, 2004-2006, and 2016-2018. Each cycle is unique. The 1994 cycle was the most aggressive: over the course of 12 months, the Fed raised the funds rate from 3% to 6%, including two hikes of 50bp and one of 75bp. Meanwhile, in 2004-2006, the Fed tightened in “measured” increments of 25bp, ultimately raising the funds rate by 425 bp over two years. Finally, 2016-2018 was the slowest and shallowest cycle in modern central banking history, as the Fed raised rates on a quarterly basis over 2 years, only pausing to commence balance sheet normalization in September 20171.
What was consistent in the latter two cycles referenced above was the telegraphed nature of the imminent hikes. This strong similarity to not upcoming rate hikes, but to the post-GFC full transparency Federal Reserve that we enjoy today. This anticipation ahead of the cycles in ’04-’06 and ’16-’18 is almost a mirror image of what we’ve seen in 2021. The
market anticipated the 2004 cycle: yields rose 100bp in the three months prior to the first hike, and then consolidated for approximately three months before making new highs. Finally, in 2016, the market anticipated the hikes as well, but the magnitude of follow through was somewhat more muted, as the Fed was raising rates at half the pace observed in 2004:
Turning to the curve, the long end tends to show relatively consistent behavior across the analyzed cycles: anticipation of a shift in policy before the hiking cycle and continues to flatten after liftoff.
What makes this environment particularly different than these previous cycles? Just about everything we’ve laid out regarding the economic backdrop above. This cycle is set to begin with the tightest labor market in the modern era along with a solid backdrop of fundamentals that would suggest the economy is poised to absorb the blow of higher rates just fine. This brings into question the current slope of the curve and what might be driving these expectations from market participants.
1 FRED
2 Chart provided by JPMorgan.
If the labor market continues tighten and these pillars of growth are as sturdy as they appear to be, this should lead to a steeper sloping curve that what we’re dealt today in December of 2021. Intuitively, one would expect that we should be biased toward a flatter curve given the outlook for the Fed next year and the behavior of the curve around previous tightening cycles discussed earlier. However, we believe the long end has run ahead of itself, and it may take some time for traditional tightening dynamics to reassert themselves. This would lead us to support a short duration and greater convexity profile within fixed income portfolios, particularly in the first half of next year.
Labor
Labor force participation dipped with the onset of the pandemic. However, even with the ongoing normalization of activity apparent in measures like daily mobility, the share of working-age Americans who are engaged in the labor market remains subdued. This partly reflects the steady, slow-moving influence of demographic forces. But it also reflects more recent cultural shifts, including a jump in retirements. Labor supply has also been throttled back by an ongoing decline in working-age immigration.
While job growth in 2021 was solid, the very elevated level of job openings and strong wage gains indicate firms’ ongoing need for more workers. We look for labor demand growth to remain robust in 2022. The simple reason for this expectation is that prospects for business sales growth should be firm again next year:
- Expectations for income growth are robust and the aggregate balance sheet of the household sector is in great shape, supported by soaring asset prices and $2.5 trillion of “excess saving.” We look for real consumer spending to expand 3.1% next year and pent-up housing demand to support another strong albeit more subdued year for house price appreciation 3.
- Business has a lot of catch-up spending to do to restore depleted stockpiles. And business fixed investment, particularly for tech, should support a firm growth in real capital outlays.
- Past and potentially future fiscal actions by Congress should boost government outlays at all levels.
- The global backdrop also looks benign, though we look for another year in which U.S. import demand growth outstrips foreign demand growth for U.S. goods and services, which from a current account perspective would accommodate an expected drop in the saving rate.
3 Data from Bloomberg database.
Inflation
The surge in consumer prices in 2021 did not appear to be primarily a labor cost story. Instead, surging consumer demand particularly for goods stressed the ability of the supply chain to keep up. As alluded to earlier, there are some signs that this source of inflation may be easing. However, the support to pricing may now be pivoting to the more common channel of a tightening labor market pushing up wages, business costs, and business output prices. Thus, while we expect the very strong inflation prints of this year to indeed be transitory, pricing power should remain firm next year again, at least by the standards of the last expansion.
Equities
Since 1980 and during the early phases of the four business cycles, equity markets were broadly bullishly biased; and, during the first three cycles, the market saw limited pullbacks within those trends. Within three of those four business cycles, the larger of the setbacks during those phases were 6.5-8.8% in amplitude ahead of the first rate hike. The post-GFC cycle saw more substantial moves, but importantly, each of the corrections before the first Fed Funds rate hike proved to be good buying opportunities. As a base-case view, we expect a continued broad market rally, albeit one somewhat decelerated versus the early-cycle recovery pace. We also do not expect any broad index setback to reach correction territory. In absolute terms, P/E multiples are elevated, but not equity yields vs credit & bond yields. Notably, there was significant broad multiple compression this year, driven by very strong EPS growth, and we expect in 2022 there will be further, mild P/E compression. The cushion before rising yields hurt the overall market remains significant.
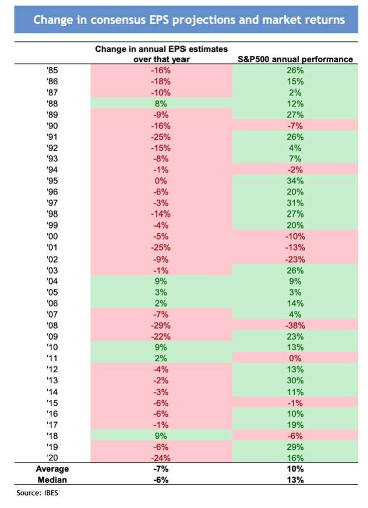
We expected a strong earnings upswing this year. Q2 / Q3 earnings delivery was encouraging, supported by the unwinding of COVID-19 dislocations, acceleration in activity momentum, and easy base effects. Notably, Q4 consensus hurdle rate is also below Q3 delivered. Further surprises are likely in Q4 reporting season vs the consensus EPS growth expectations for next year are relatively modest, especially considering the upbeat GDP growth forecasts. Even if EPS revisions end up turning negative, we note that was not historically a reason to be bearish on the market direction (table below4). We had a spell of very strong EPS delivery over change in consensus EPS projections and market returns the past few quarters. This could be changing, but it is important to note that downgrades to consensus EPS projections were a norm, and equity market would still be moving higher in the background.
4 Table provided by JPMorgan.
Investor vs Headlines
It’s a pretty linear line to draw that if we’re comfortable in our stance that 2022 will resemble more of our pre-pandemic lifestyles and economy then risk assets should find themselves in a favorable situation. Specifically, within the equity markets we feel there is likely to be an appetite in the short term for cyclically related assets. But we think investors should take a second to assess whether this “return to value” has been as much of a winning trade as it’s been made out to seem. Halfway through December, the Russell 1000 Value (R1000V) has returned more than 21% in 2021. A fantastic MSCI USA Quality index has outpaced this return by 2.5%. The Russell 1000 Growth (R1000G) has topped the R1000 Value by more than 100 basis points as well5. In fact, after Memorial Day, the R1000G has climbed by more than 16.5% on a total return basis vs a 2.46% total return for the R1000V through the middle of December.
5 Data from Bloomberg database.
Factor Preference – Cash Rules Everything Around Me
For several years we’ve been encouraging investors to ditch the style box. We didn’t believe it was an accurate tool to explain investment options or security classification. We feel that 2021 was a perfect example of just how misleading broad paint brushes can be when trying to dissect the market, or worse try to explain market movements. Heading into 2022, investors are asked to juggle three expected rate hikes, an accelerated reduction in bond purchases and a multi decade high inflation. With this backdrop in mind, blindly declaring technology dead and the regime of growth names coming to end is likely to be a fatal mistake. Instead, we implore investors to follow the money.
As higher supply and labor costs eat into post-pandemic margin expansion, the equity factors and sectors with the highest operating margins and lowest labor intensities stand to benefit. We maintain a preference for higher quality characteristics across all industries and believe investors will be best suited to not chase momentum rallies in traditional “value” areas of the market. Additionally, consumer changes in behavior brought about by the pandemic necessitate selectivity as, for example, alpha opportunities ripen in disruptive, emerging technologies not usually captured by traditional sector breakdowns. Semiconductors are the backbone of powerful emerging technologies including artificial intelligence and digital payments, and the subsector offers a relatively high free cash flow yield a fundamental indicator often used by investors to asses measuring the amount of operating cash it generates relative to its valuation.
Time
“Many failures can be traced to the pointless pursuit of arbitrary benchmarks. Most notable is the calendar, which pushes investors to cut corners before the earth completes its rotation around the sun. Swap out the sun for another celestial body and you’re describing a mental illness. Another is indexes. Which use something short-term and broad to guide something long-term a – Unknown
No investor is comfortable with losing money. So, when our self-inflicted timing mechanism is telling us that time is running out, there is a natural tendency to become hyper-sensitive to our gains or losses. The bear market that overtook the S&P 500 in 2018 might have added insult to injury for many investors given the time of the year it took place. A calendar year that was on pace to see a 15.7% return ended the year lower by more than 6% in price terms.
6 Data from Bloomberg database.
But unless you are a professional money manager with annual bogeys and incentives for
individual calendar year returns. Keeping in mind most investors spend more than 20+ years in the market in their lives, it’s key to remember that these single inputs are what
the averages investors come to expect.
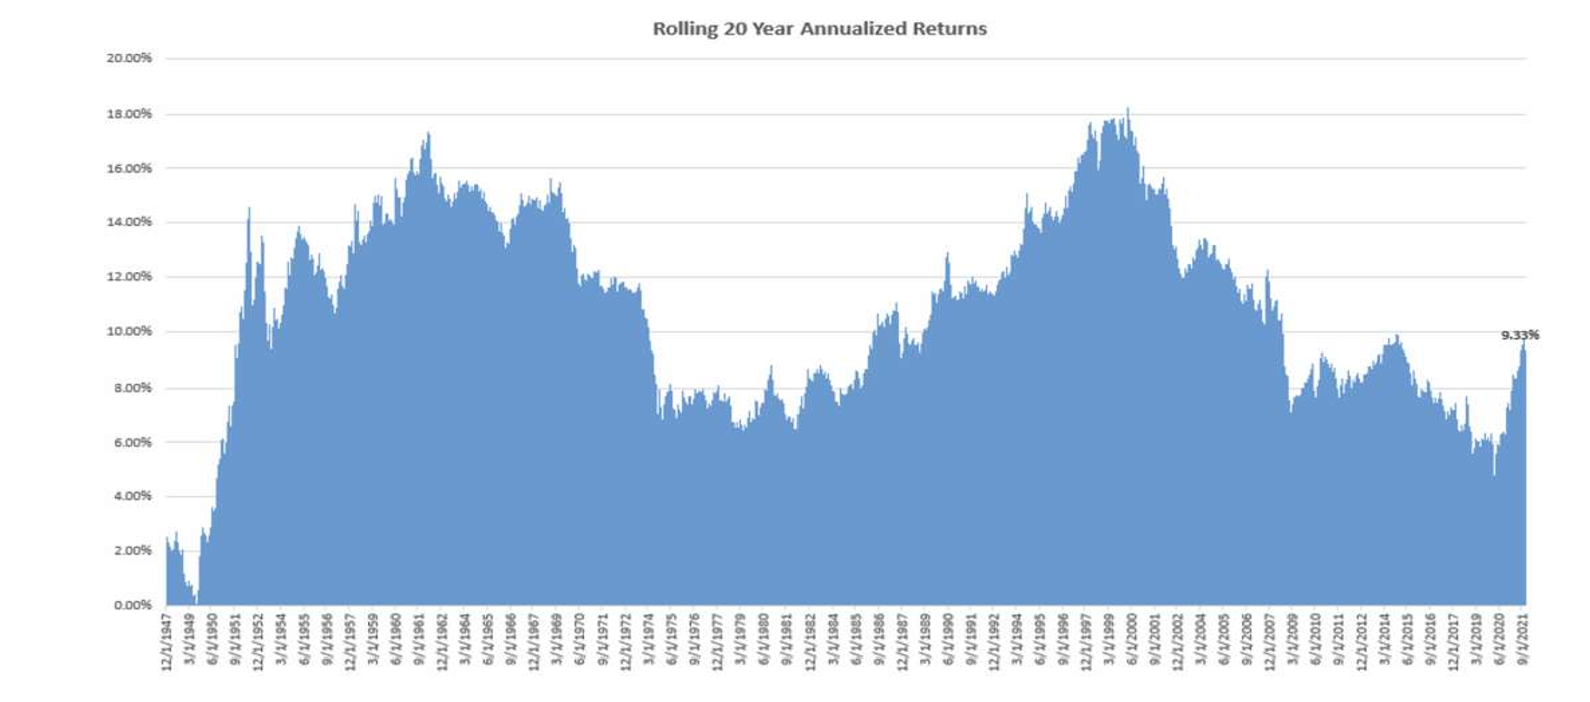
Looking at rolling returns, the S&P 500 has only three 20-year rolling period where returns were negative. Each of which took place before 1950. In other words: the S&P 500 has not experienced a negative rolling 20-year return period. Rolling 10 and five-year returns look promisingly similar. On a rolling 10-year basis, the S&P 500 has seen 12 windows of negative returns, 75% of which took place prior to 1980. Eighty-six percent of rolling 10-year windows since 1937 have been positive, annualizing at 7.36%. Seventy-five percent of five-year rolling returns have been positive since 1932, annualizing at a rate of 9.33%7.
We don’t think investors should dismiss years of struggle and bank on the averages working themselves out over the long-term. That would be pure ignorance, and ignorance isn’t bliss. Ignorance is suicide.
Ignoring weakness within the environment you’re presently in will increase the chances of you being met with something you’re not ready to handle and will potentially jeopardize where you intended to reach in the first place.
7 Data from Bloomberg database. Chart generated by GFG Capital.
Being able to count on a long-term investment horizon is a blessing and a curse for investors. It often serves as a pacifier for times of struggle within the market, or disappointment within a portfolio. Like a disgruntled sports fan, “there’s always next year” is a consolation they can tell themselves knowing they still have future opportunities.
But when that reminder begins to lose its effectiveness, investors can start to press. Force trades, convince themselves new opportunities should be sought out or abandon completely the process that’s been put in place. The privilege of a long-term time horizon requires investors to possess the stamina necessary to survive it. While it’s true, a lentghy time horizon carries what might seem like endless possibilities to expand your wealth, it also can be dark and full of terrors at times.
Listen twice, speak once. A mantra Tupac Shakur once echoed when discussing the
of this advice when it comes to observing their portfolio. Managing your emotions twice as much as you manage your portfolio is a good way to help build the stamina necessary to survive your long-term time horizon in the markets.
Then again, who’s got time for that?