

One market exceeds $400 trillion in assets and the other receives nearly all of the attention from financial media and investors despite it being about one third of the size. We’re not innocent here either, but the bond market has been a relatively placid body of water to navigate for quite some time. Extremely low (non-existent in some cases) yielding opportunities have forced investors to ignore the $400T gorilla in the room to a certain extent, while they’ve sought out alternative opportunities in the equity market. But with tides changing, it might be a good time to remember that equity behavior is the tail and the bond market is the dog.
WHAT’S HAPPENING TO BONDS
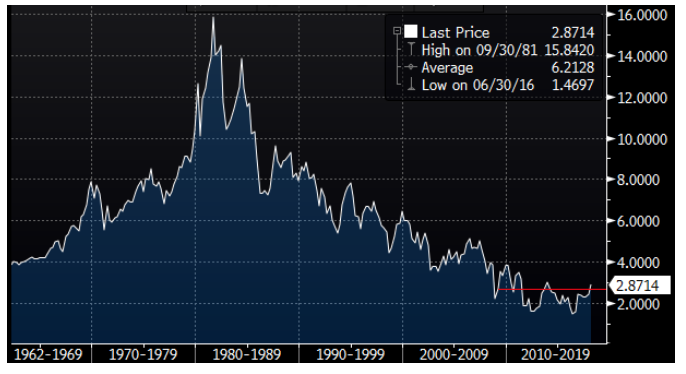
We’ve seen bonds carry out a bull market for close to three decades coming into 2018. This has lulled investors on both ends of the spectrum to sleep and the alarm clock is blaring in their faces. Don’t hit snooze, it’s time to get up. Courtesy reminder that bond yields rise when prices fall. Take a peek at what the yield on the 10-year U.S. Treasury has done over the last 40ish year’s below1. It’s important to put what we see every day into some form of context, and historical context often times helps us cool our jets a bit. Granted, the move from the decades lows we saw in 2016 to the multi-year highs we’re experiencing currently appears to be swift in the micro. But in the macro, we’re far from where we’ve been historically, and expectations shouldn’t all of a sudden shift to us seeing a move in the bond market back to historical levels. But many investors might be asking why the behavior in bond yields are impacting their equities: tail, meet dog.
WHAT’S IN A YIELD
The yield is the premium or discount an investor is willing to take on for purchasing the underlying debt being issued. In this case, we’re talking about 10-year U.S. government paper (the perceived risk-free rate). Investors, and collectively the market, are tasked with determining what the yield should be, given a list of fundamental factors impacting the likelihood of the debt being repaid. Typically, domestic and global economic growth prospects play a significant role in what someone is willing to earn in return, annually, for $100 invested in the issue. Taking into consideration current growth rates, sustainable growth expectations and deficit sizes are just some of the boxes these investors need to check. Other important factors that come into play are inflation expectations and supply and demand. Two things we’d argue are playing a significant role in the moves in yields this year. A rising inflation expectation would mean bond investors are demanding a greater real rate of return in order to keep up with the coupon erosion. The other factor is relevant to any marketplace: supply and demand. Balance sheet normalization is expected to pick up through 2018 and into 2022. Here’s a reminder of the maturity schedule of the Fed’s current maturity distribution (i.e. amount of capital that’s not being redeployed into the market).
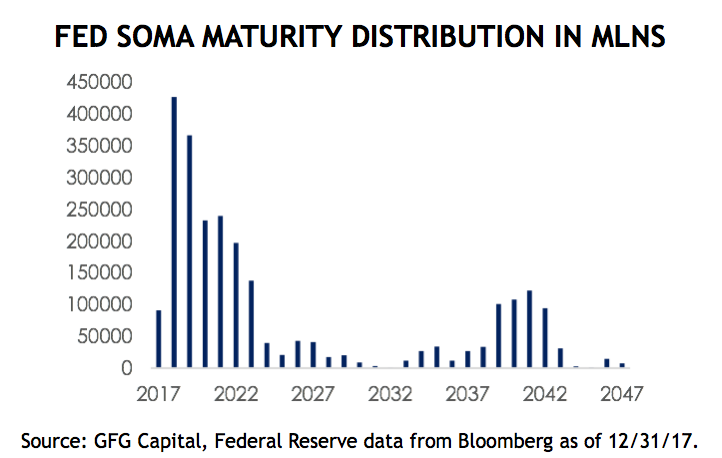
When one of the largest buyers are actively exiting the market, a flood of supply will be met with diminishing demand. Not to mention China and Japan, the two largest foreign holders of U.S. government debt, are seeing their stock piles shrink as well. So, to recap: rising inflation, increasing supply, increasing deficit and late-stage economic cycle. All pretty logical reasons why bond investors might be demanding more bang for their buck. But, you’re here to understand why that impacts your stock portfolio. We’re about to explain why.
EQUITY RISK PREMIUM
The equity risk premium (ERP) is the perceived, and later verified, premium an investor receives above and beyond the risk-free rate of return they’ve passed on in favor of excess risk. The premium isn’t a guarantee, even the risk-free rate isn’t. But it’s generally used as a measuring stick for how investors should be compensated relative to the alternative. Equity risk premiums are as dynamic as the bond yields that are used to calculate them. Investors have been working in an environment where they’ve been paid very little to take on minimal risk for quite some time, which has forced investors outward along the risk spectrum. Yield-starved investors have had little choice but to step outside their comfort level, for better or for worse. But the pendulum is never stagnant. As we see bond yields march higher to levels that many thought we would not see for years (without a recession), the market is having to rerate essentially every major asset class at once. Nobody said this was going to be easy. Historically the ERP for the S&P 500 has been 4.7%. If you take into account just the nine years coming out of the Great Financial Crisis (GFC) then that premium drops to about 4.5%5. Take a look at what starting ERPs tend to mean for equity returns on a forward-looking basis dating back 90 years (shout out Ben Carlson).
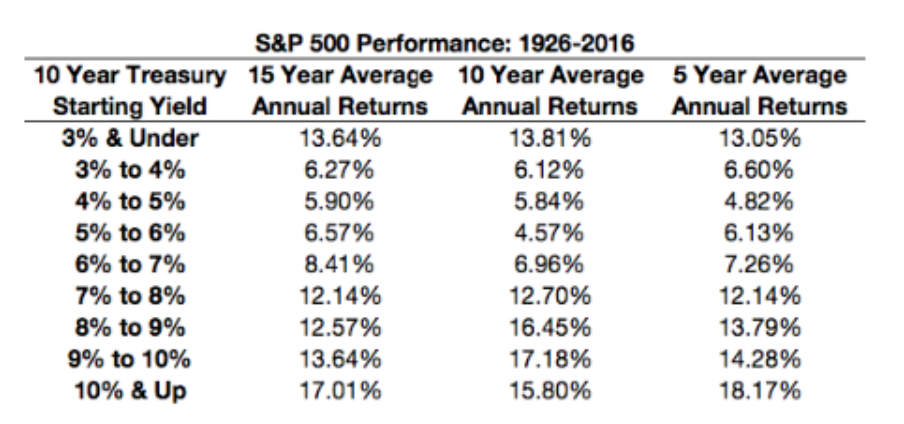
Two things worth keeping in mind: Those long-term ERPs are being measured with considerably higher average risk-free rates than what we’ve experienced coming out of the GFC, and the period outlined above of yields below 3%6 are largely being met with extraordinary accommodative monetary policy.
For this reason, the subjectivity of the ERP is on full display. What is that risk worth to you personally? Historically, investors have shown their comfort with 4-5% premiums being paid for equities on average. So, if you entered the year with an expectation of equities returning (insert magic number generated from some year-end S&P 500 target), and that risk-free rate has just made a measurable move higher, it’s time to revisit the environment you’re in. If the risk-free rate is at 3% (rounding up for argument’s sake) and you demand that 5% premium, do you still believe equities can manufacture that 8% return? Do you require a greater premium? Smaller one? These long-term relationships don’t hold forever. Times change, and appetites change with the markets. We’re not saying this time is different, we’re saying every time is different.
So, what’s it worth to ya?
SOURCE: This presentation is solely for informational purposes and should not be taken as investment advice. For further information, please contact one of our investment adviser representatives. 1 Bloomberg. 2 Factset. 3 Financial Analyst Journal. 4 Factset. 5 Professor Damodaran, NYU Research. 6 Chart provided by A Wealth of Common Sense, Ben Carlson.