

It wasn’t even two months ago that the market was throwing a complete temper tantrum and volatility burst through the wall like the Kool Aid Man. For far too long, investors let greed get the best of them and caught on to the short volatility trade opportunity that had manifested itself over time. By continuing to bet on a low volatility environment, investors were picking up pennies and all but forgot the steamroller was right behind them. Now, the flipside of that trade is luring investors in. What’s the saying down in Tennessee?
MEMORY LANE
As a quick reminder, let’s recap the awakening that took place in February. We entered the year coming off record low volatility in global markets across the board, but perhaps no market was more silent than the S&P 500. This was a trend that had persisted for quite some time with record number of days without a move in the index, up or down, exceeding 2%. For over 440 trading days, the S&P 500 was in a historically tight trading range1. That’s almost two years. All the while, investors found it convenient to place their bets that the volatility regime would persist and sought out ways to exploit this trade. We’ve discussed the issue with a lot of these solutions in the past, but investors across the market were piling into ETF and ETN products in order to generate an investment profile that would continue to bet against a pickup in volatility. Enter February and the VIX spiked 147% in the first few days of trading before finishing the month of March up 47% from where it began February2. What happened to the short volatility bets? Virtually everybody picking up pennies was completely flattened by the steamroller. Some, even saw a terminal loss of capital.
PRESENT DAY
Fast forward (six weeks) and investors are trying to deal with a slew of “reasons” as to why volatility is back and it’s here to stay. It’s seldom as easy as one explanation as to why markets do what they do. But market pundits nevertheless persist in their quest to uncover one. File this under noise. As always, the market is continuing to be the dynamic and fluid organism it always has been. We’ve touched on one of the fundamental changes capital market participants are being forced to digest today, and we think it’s worth revisiting given the attention it’s garnered over the last few weeks.
BOND YIELDS AND VOLATILITY
Bond yields have been on the move and a hot topic to this point of the year. Along with the trade discussion, bond yields are one thing we’ve given a reasonable amount of attention to. Fundamentally speaking when bond yields move, markets need to adjust. But with the recent history being what it is, investors are being a bit quick to extrapolate their assumption of what this means for stocks. Bond yields are rising, volatility has returned, so this must be a recipe for disaster for stocks, right? Not so much. There is no law of investing that says rising bond yields translates to falling stock prices. Nor is it written that rising bond yields trigger a spike in volatility. Do adjustments in bond yields mean a re-rating of risk assets occurs? Absolutely. But that doesn’t necessarily mean those assets move lower. In fact, more times than not, equities, bond yields and volatility can move higher together. You know what tends to not move higher? Volatility ETF and ETN products. We went through several counter-trend moves in bond yields (aka periods where bond yield moved higher) since the start of the bull market in bonds since the ‘80’s. Take a look at these relationships:
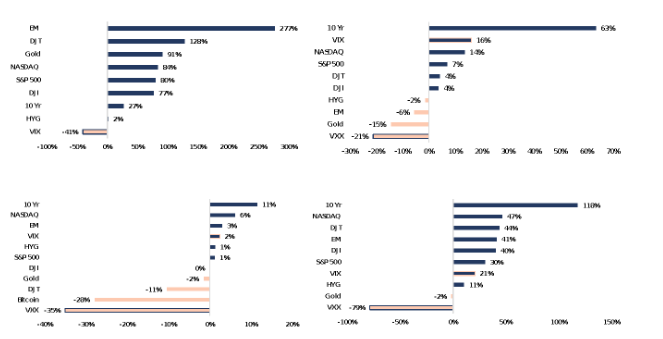
There are a couple things to unpack here. First, as you can see, bond yields can, and have, moved higher in tandem with equity prices. Equity volatility has picked up in three of the four most recent countertrend movements in bond yields. In the three scenarios where VXX was available to investors (its inception dates back to 2009) the ETN posted double digit losses, the most recent decline totaling 79%. The VIX? Double digit gains in two of three periods. So much for going long volatility. But with equities holding up, should investors really be too concerned with trying to benefit from the short-term pickup in volatility? We don’t think so. At least not through the use of one of these VIX “tracking” products. Another takeaway from these scenarios is volatility doesn’t automatically translate to negative equity performance.
But what about the bond yield and volatility relationship? A closer look at these two will show there isn’t as strong of a bond between the two as investors conceptually may have thought.
To the right we highlight the moves in the U.S. 10-year relative to the VIX, since the index was formalized in 1990. The relationship between the two has been minimal with a r^2 of just .0813. For comparisons sake, the VIX and S&P 500 carry a relationship quantified as 0.39 r^2 in the same time period4. Depending on the behavior of bond yields to gauge the next move in volatility would be tricky business given that relationship. That brings us back to the point that bond yields may be part of a rationale behind market gyrations, but pinpointing a single indicator can often times simply be coincidence, not significance.
With volatility appearing to be returning back to its natural form: an unpredictable, mean-reverting, tough-to-track indicator of sentiment; we acknowledge the itch to find a way to benefit, or defend a portfolio from it. We think the best defense comes from an investment process that was sound from the start and based on evidence. Staying the course has proved to be a wise move, and we recently saw what happened to investors who tried to game the system. There are additional ways to defend one’s principal, and peace of mind, but we don’t think these investment solutions are as clever as they’re sold to be. Seek advice from an investment professional who doesn’t have a hidden agenda if a psychological defense strategy is what your portfolio really needs. But in the meantime, trust the process.
SOURCE: This presentation is solely for informational purposes and should not be taken as investment advice. For further information, please contact one of our investment adviser representatives. 1 Bloomberg. 2 Bloomberg. All data referenced above derived from Bloomberg. Charts provided by GFG Capital. 3 Bloomberg. 4 Bloomberg.