

Age is just a number, right? We go through our lives with limitations (actual and psychological) placed on everything around us by some measurement of time. Practical or not, these limitations of time and age trickle down to the deep crevasses of our mind, subconsciously dictating our perception of reality. In the world of investing this distorted reality can not only impact our bottom line, but also our comfort with a certain level of risk (and, therefore, how well we sleep at night). One of the biggest distortions of market reality today is the age old question (current age TBD) “How old is this bull market really?” Lets try to get a better understanding of reality.
VERBIAGE
Before discussing the age of the market, we first need to clarify a few things so we’re all speaking the same language. A market correction is defined by a 10% reverse in price movement from recent highs in price. A bear market is defined as a downturn of 20% or more from the peak of a stock or index price1. Bull markets refer to markets (stocks or bonds) where prices consistently rise. Now, these definitions may seem arbitrary, and you can argue that they in fact are, but they’re what we’ve been given and that is not what we’re debating. What we are going to address is whether or not the perception of this current bull market being 9 years of age is reality, or if in fact it is only 4 years old.
MEASURING STICKS
The only thing that can support the case of the current bull market turning 10 years old is that the S&P 500 hasn’t closed down 20% or more from peak to trough. This data point, while true, is not the strongest ground on which to base an argument. Lets direct our attention to 2011, two years into the perceived bull market, where the S&P 500 was down 19.38%. Futures on the same index were lower by 22%. Sound bullish? In 2011, almost 70% of the constituents of the S&P 500 corrected by more than 20% (see definition above). On a closing price basis, the equal weighted S&P 500 index closed down 23% from their previous peak in 2011 as well. All data points that don’t come across as too bullish, and this is just one index.
The Russell 3000, which represents ~98% of all investable assets in the United States equities market fell 23% from the 2011 highs. The MSCI All Country World Index declined by 27% in 2011 and another 22% in 20152. These data points don’t fit the narrative that most investors, or advisors choose to believe.
The incessant obsession with “Is this the top?” or “This is a bubble…” stems almost directly from this distortion of reality. As we mentioned this will only impact your bottom line (likely negatively) and potentially your REM cycle. So if this bull market isn’t what we thought it was, then what is it?
CAN I SEE SOME I.D.?
Lets turn our attention back to the S&P 500 since that is what dominants pundit commentary. The measurement of a secular bull market should not begin at the previous bear market trough (2009). In fact, we should be measuring the current equity bull market once the index takes out the previous market highs (shown below).
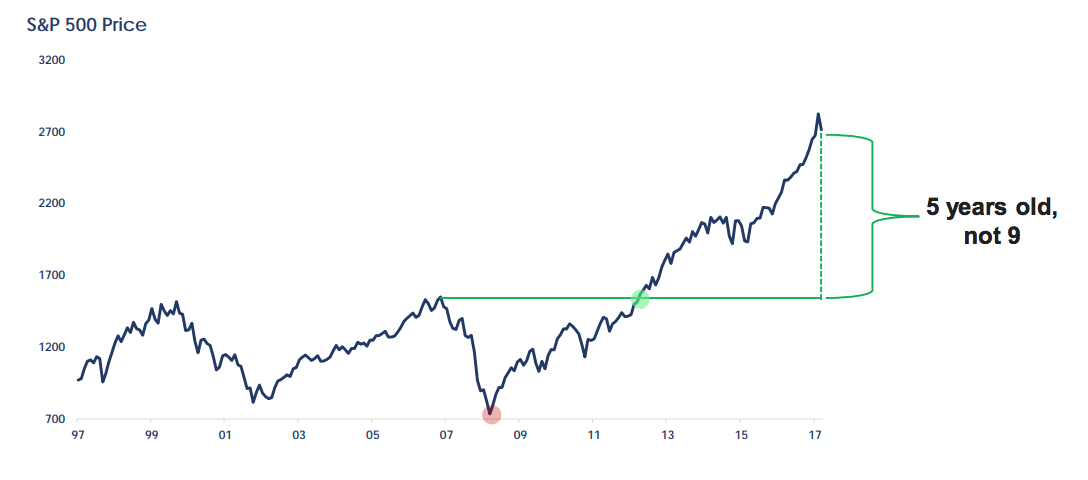
As you can see, this breakout didn’t occur until the Spring of 2013 when we broke out above the highs last set in 2007. This seems like a more realistic starting point of the current bull market, not the last 9 years which saw some extended, tumultuous periods along the way. Now, not all bull markets are created equal, and much like the milk in your refrigerator it might be best to use the smell test to see if the expiration date that has been determined for you is accurate. On average, bull markets have lasted 7 years in length. But averages are made up of extreme readings, so it is important to take historical average ages with a grain of salt.
WHY SHOULD I CARE?
This is where we tell you that none of this actually matters. Bull markets don’t die of old age. There is no maturity date slapped on a bull market when it begins, with a running clock throughout its lifetime. Investors aren’t counting down “3..2..1..” throwing up their last bid before the clock runs out like Michael Jordan. Remember those limitations we were talking about? The ones that distort our perception on reality, whether we know it or not? What does matter, is that we understand that we are in fact in a current equity bull market. But it is in fact not entering it’s 10th year. Mark Twain would tell us, “Age is a thing of the mind. If you don’t mind, it doesn’t matter.” So whatever the weekly newsletter you’ve signed up for tells you, or the next time media headlines try their best to make you think this is the end; it is important to question the message as well as the messenger’s motive. It’s easy to force investors allocations to shift by scaring them away, or into, investments that may not fit their needs or profile. So we can put the stock market doomsday checklist away, and instead maybe revisit your allocations and the investment thesis that brought you there.
Read the full piece here.
SOURCE: 1 The information contained herein was provided by Bloomberg database and GFG believes it to be true. This presentation is solely for informational purposes and should not be taken as investment advice. For further information, please contact one of our registered representatives.
SOURCE: This presentation is solely for informational purposes and should not be taken as 2 investment advice. For further information, please contact one of our investment adviser representatives. Graph generated by GFG Capital. 2 Bloomberg