

Market Timing is a Losing Strategy
Market volatility can be unsettling, but the bigger question for investors is whether they are truly investing in businesses or simply trying to time market movements. The temptation to react to short-term swings is powerful, but history overwhelmingly favors those who stay invested rather than attempting to predict market tops and bottoms.
The historical rolling annualized total return chart reinforces this reality. Over short timeframes, returns for U.S. stocks, bonds, and balanced portfolios have varied widely. The 1-year period shows extreme volatility, with stock returns ranging from -41% to +60%. However, as the time horizon extends, volatility diminishes, and returns converge toward long-term averages. Over 30 years, the spread narrows significantly, with stocks averaging around 10.8% and balanced portfolios delivering more stable, albeit lower, returns.
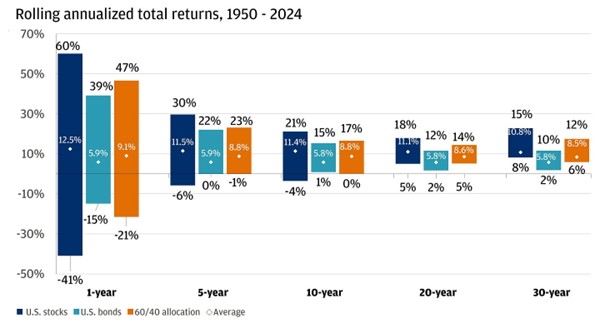
[1] Chart provided by J.P. Morgan. Past performance is not a guarantee of future results.
The key takeaway? Short-term fluctuations are unpredictable, but long-term investors benefit from the compounding effects of equity ownership. The longer the holding period, the higher the probability of achieving positive returns.
Over the past two decades, missing just the 10 best days of each year would have reduced annual returns from +12% to -10%. The biggest up days tend to follow sharp selloffs, and attempting to sidestep volatility often results in missing critical recovery periods. Investors who trade in and out based on short-term narratives risk locking in losses rather than participating in recoveries. Moreover, the correlation between economic cycles and market movements is rarely clean—some of the best investment opportunities arise precisely when fear dominates the market.
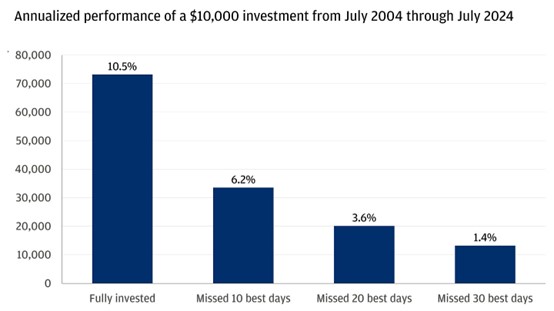
[2] Chart provided by J.P. Morgan. Past performance is not a guarantee of future results.
Volatility is Normal—Even if it Doesn’t Feel Like It
Market swings of 5-15% occur every year, with an average annual drawdown of 14%. Despite these fluctuations, markets have continued to deliver strong long-term returns. Reacting emotionally to drawdowns is often counterproductive—the long-term trend remains intact.
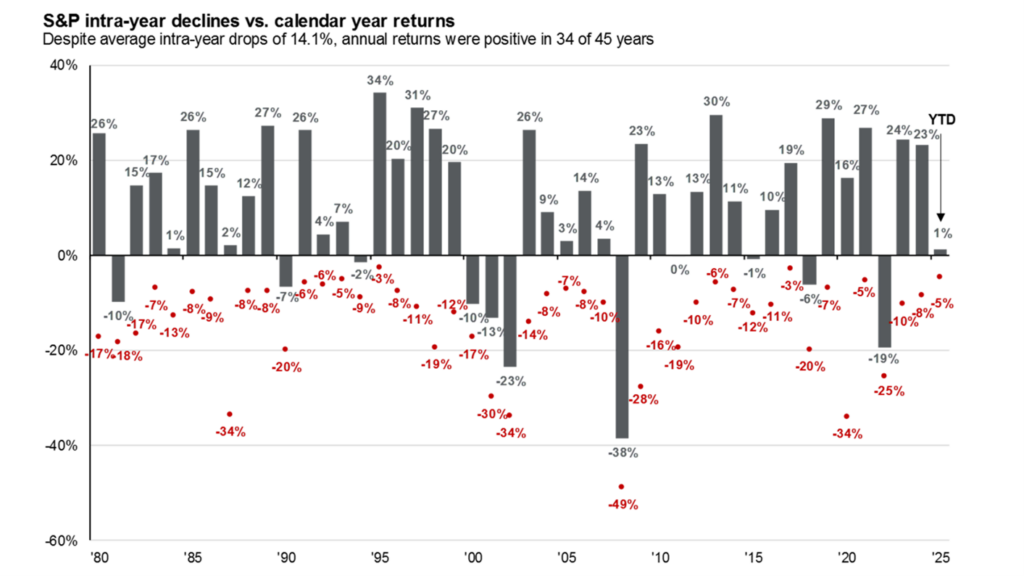
[3] Chart provided by J.P. Morgan. Past performance is not a guarantee of future results.
Amazon, a stock that has returned over 40,000%, has faced average annual drawdowns of 33%, with multiple instances of 70-90% declines along the way. Market returns are not linear; they move in a staircase pattern, where corrections and rebounds are part of the cycle. Even at the index level, historical data confirms that volatility clusters around key macroeconomic or geopolitical events but rarely alters the fundamental trajectory of markets over a multi-year horizon.
This means that investors need to assess their risk tolerance and positioning through an objective lens rather than reacting to short-term movements. If history is a guide, long-term participation remains the dominant driver of wealth accumulation.
Sentiment is at Crisis Levels — A Contrarian Buy Signal
Investor sentiment has collapsed to levels typically seen during economic crises. The AAII Investor Sentiment Survey reflects extreme bearishness, mirroring conditions last observed during the COVID crash and the 2008 financial crisis. Such sentiment tends to be most extreme right before major inflection points.
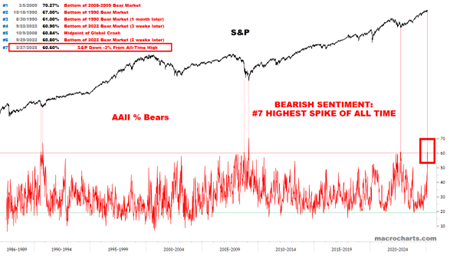
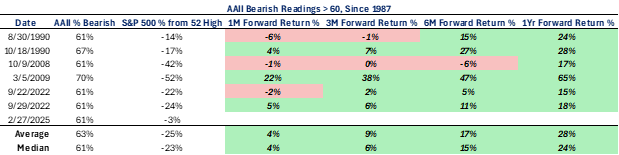
[4] Chart provided by Macrocharts.
[5] Table provided by GFG Capital; data provided by Bloomberg database. Past performance is not a guarantee of future results.
Technical Selling vs Fundamental Reality
Sentiment alone doesn’t move markets—flows do. Current price action suggests that forced liquidations, particularly from hedge funds reducing exposure, are driving market declines rather than fundamental deterioration. Periods of aggressive deleveraging often lead to price action that is disconnected from fundamentals, creating distortions in valuation.
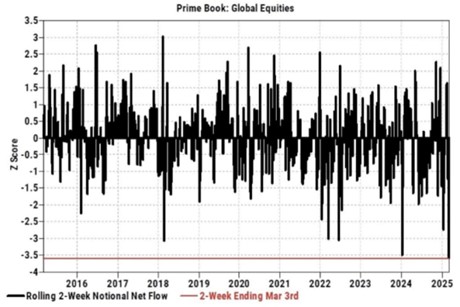
[6] Chart provided by Goldman Sachs
Hedge Funds sold stocks globally at the fastest pace in history over the last 2 weeks. Related, Hedge Fund stock overweights had the worst 3-week drawdown in history (worse than 2020). Additionally, CTA’s dramatically cut their long equity exposures posting a wild swing from max long to nearly max short positions.
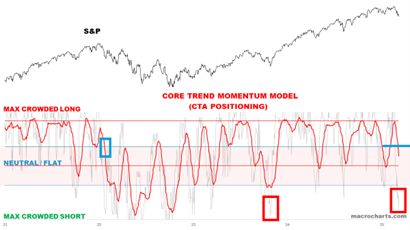
[7] Chart provided by Macrocharts. Past performance is not a guarantee of future results.
The S&P 500’s forward 12-month P/E has contracted from 22.5x to 20.5x (a 9% decline), while forward earnings estimates have actually ticked higher over the past week. This signals that selling pressure has been largely technical, not rooted in earnings deterioration. Historically, such dislocations have created opportunities, particularly for investors who can take a long-term perspective and separate fundamentals from temporary market dislocations.
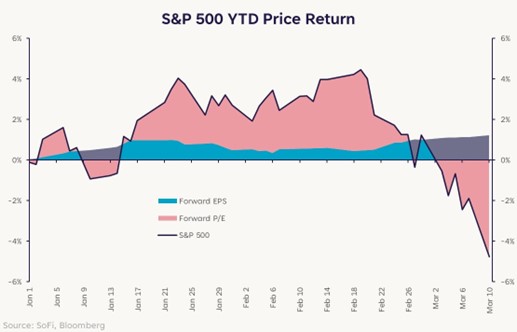
[8] Chart provided by Sofi. Past performance is not a guarantee of future results.
If the current pullback is going to devolve into a full-blown correction, history suggests it should do so quickly. Looking at past corrections, 76% have played out within a 60-day window (mid-April), and about half have resolved in under 40 days (late March). The chart below juxtaposes the current pullback against all 10% corrections since 1950, showing how these declines tend to take shape. While it remains to be seen whether this drawdown deepens further, the historical pattern suggests that if a correction is coming, we’ll likely know soon.
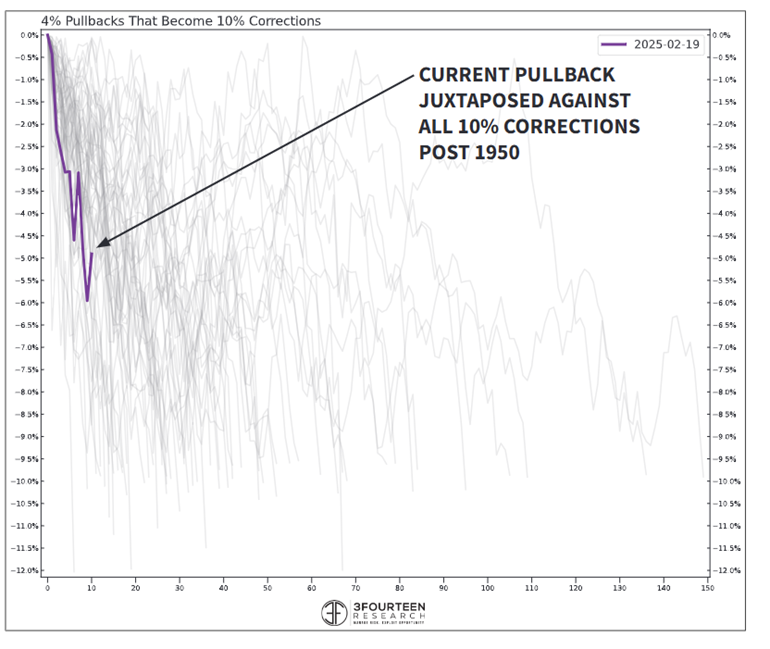
[9] Chart provided by 3Fourteen Research. Past performance is not a guarantee of future results.
Consumer Discretionary vs Staples—A Sign of Overreaction?
The 15-17% drop in consumer discretionary stocks relative to staples resembles moves seen in severe economic downturns. Typically, such shifts occur when economic distress is already present—not in anticipation of it. For example, the move in discretionary vs staples we saw last week was the most extreme move in favor of staples since March 2020, October 2008 and 9/11. This suggests that markets are reacting to fear rather than reflecting current economic conditions.
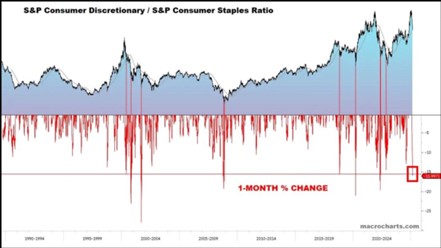
[10] Chart provided by Macrocharts. Past performance is not a guarantee of future results.
High-Beta vs. Low-Beta had one of the worst two-week plunges in history. The only other periods with *slightly* worse negative returns were March 2020, August 2011, and October-November 2008 — all at/near panic bottoms. That 2025 is even in the ranking, says how far this has gone.
While policy uncertainty around tariffs, interest rates, and regulation is real, the downside risks appear priced into the areas most affected. If recession risks were as imminent as these relative moves suggest, we would expect credit markets to reflect more severe distress. However, corporate bond spreads and default risk indicators remain relatively stable, underscoring the possibility that equity markets are pricing in excess fear.
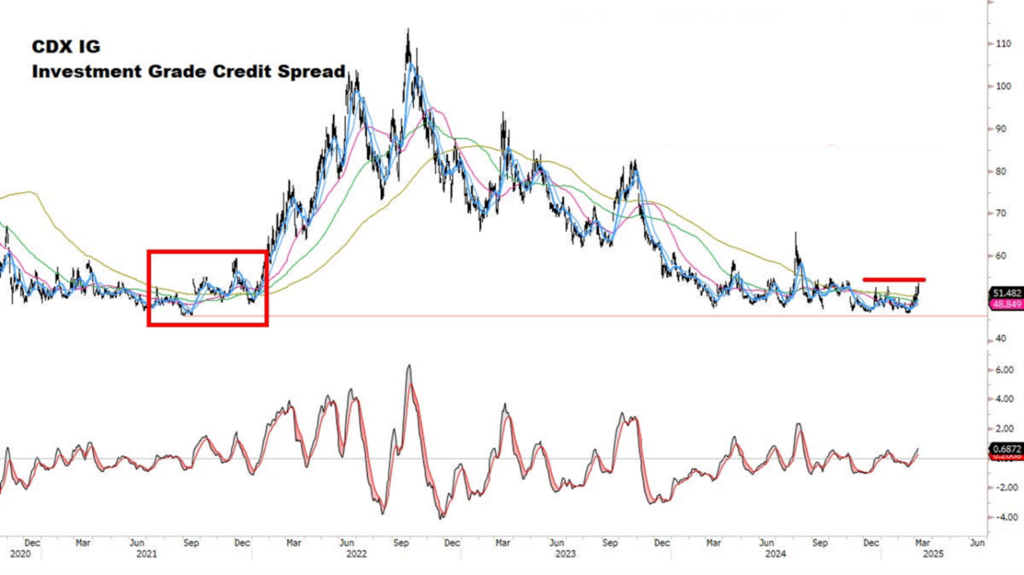
[11] Chart provided by Macrocharts. Past performance is not a guarantee of future results.
Policy Uncertainty and Market Multiples
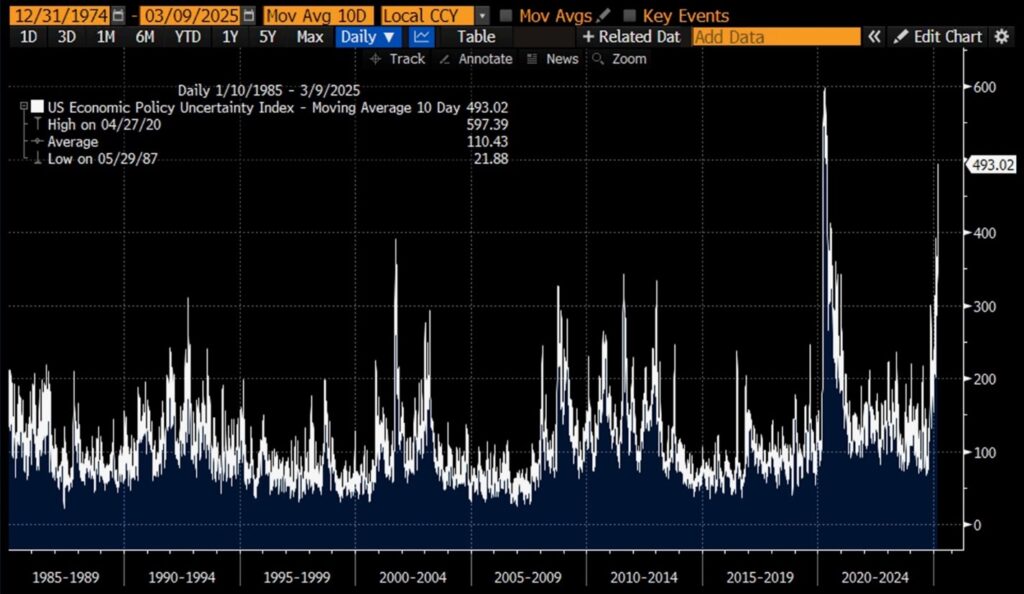
[12] Chart provided by Bloomberg database.
The U.S. economic uncertainty index has climbed to levels last seen during COVID. This reflects a lack of confidence in policy messaging rather than tangible economic deterioration. A distinction needs to be made between uncertainty-driven volatility and actual economic weakness.
Economist Frank Knight distinguished between risk (quantifiable probabilities) and uncertainty (unknown probabilities). Markets treat them interchangeably, but they are fundamentally different. Risk can be measured and priced in, while uncertainty introduces unpredictability, leading to exaggerated volatility and multiple contraction.
For businesses, policy uncertainty leads to inaction. Companies can adapt to favorable or unfavorable policies, but unpredictable shifts create hesitation in capital allocation. The longer uncertainty persists, the more likely it is to weigh on corporate decision-making, particularly in sectors reliant on stable regulatory environments.
For investors, rising uncertainty raises risk premia, leading to multiple contraction. If 22x forward earnings was “priced to perfection,” current conditions suggest that valuations could adjust toward 17-19x to reflect heightened uncertainty. Should economic data weaken further, the Fed may be forced to pause, leading to a revaluation of expectations. However, if uncertainty begins to clear, compressed multiples could present re-rating potential.
Tech Insiders Are Buying—What Do They See?
Corporate insiders in the technology sector are buying their own shares at a pace rarely seen before. While individual motivations vary, a bottom-up view suggests that fundamentals remain strong, demand is resilient, and valuations in mid-to-small-cap tech are compelling. Historically, insider buying has been a reliable signal of confidence in long-term business prospects, particularly when occurring at scale. While past performance is no guarantee, such buying activity has frequently coincided with attractive entry points for long-term investors.
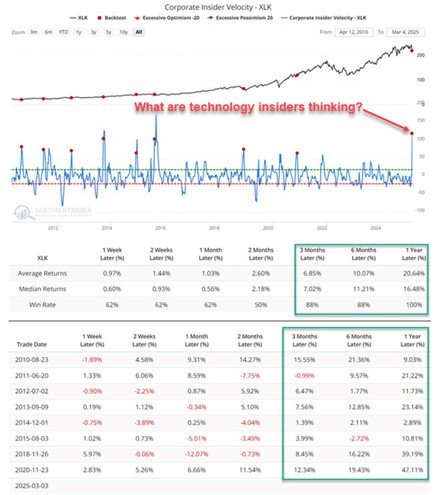
[13] Chart provided by Sentiment Trader. Past performance is not a guarantee of future results.
Our view aligns with the Bloomberg Intelligence CIO software survey, which shows that over 93% of CIOs expect to maintain or increase their software budgets in 2025. Despite macroeconomic uncertainty, technology spending remains durable, reinforcing the case for long-term investment in the sector. The increasing pervasiveness of technology across industries further cements its position as the dominant market weight. If anything, the shift toward AI-driven efficiencies, automation, and cloud adoption is accelerating, presenting opportunities across multiple subsectors.
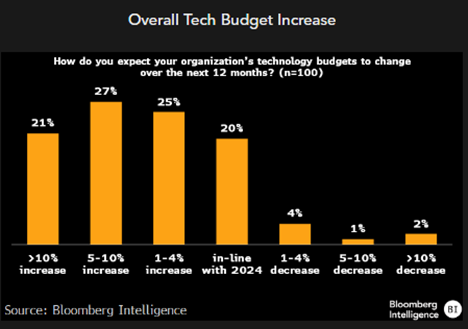
[14] Chart provided by Bloomberg database.
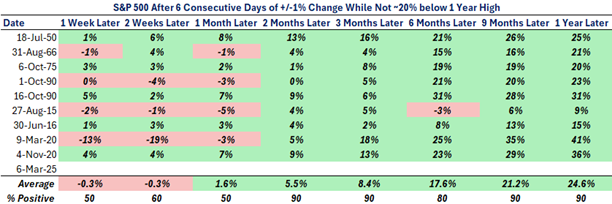
Volatility Sets Up Strong Forward Returns
Sharp market swings, particularly alternating 1% up and down days, have historically preceded strong long-term returns. Elevated volatility is often a precursor to market stabilization and recovery. If the economy remains stable, which is our base case based on both top-down and bottom-up data, then forward returns could be robust.
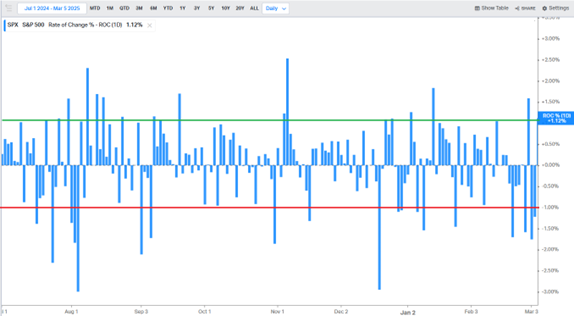
[15] Chart provided by barchart.com. Past performance is not a guarantee of future results.
[16] Table provided by GFG Capital; data provided by Bloomberg database. Past performance is not a guarantee of future results.
Periods of elevated volatility are uncomfortable but necessary components of market cycles. Historically, some of the strongest market advances have been preceded by bouts of indiscriminate selling and negative sentiment extremes. Investors who recognize this dynamic and maintain disciplined positioning are often rewarded.
Volatility is never comfortable, but it is normal. The historical data confirms that periods of extreme sentiment and forced liquidations have often led to strong market rebounds. Investors who can endure the noise are typically rewarded over time.
IMPORTANT LEGAL DISCLOSURES
CURRENT MARKET DATA IS AS OF 03/11//2025. OPINIONS AND PREDICTIONS ARE AS OF 03/11/2025 AND ARE SUBJECT TO CHANGE AT ANY TIME BASED ON MARKET AND OTHER CONDITIONS. NO PREDICTIONS OR FORECASTS CAN BE GUARANTEED. INFORMATION CONTAINED HEREIN HAS BEEN OBTAINED FROM SOURCES BELIEVED TO BE RELIABLE BUT IS NOT GUARANTEED.
THIS PRESENTATION (THE “PRESENTATION”) HAS BEEN PREPARED SOLELY FOR INFORMATION PURPOSES AND IS NOT INTENDED TO BE AN OFFER OR SOLICITATION AND IS BEING FURNISHED SOLELY FOR USE BY CLIENTS AND PROSPECTIVE CLIENTS IN CONSIDERING GFG CAPITAL, LLC (“GFG CAPITAL” OR THE “COMPANY”) AS THEIR INVESTMENT ADVISER. DO NOT USE THE FOREGOING AS THE SOLE BASIS OF INVESTMENT DECISIONS. ALL SOURCES DEEMED RELIABLE HOWEVER GFG CAPITAL ASSUMES NO RESPONSIBILITY FOR ANY INACCURACIES. THE OPINIONS CONTAINED HEREIN ARE NOT RECOMMENDATIONS.
THIS MATERIAL DOES NOT CONSTITUTE A RECOMMENDATION TO BUY OR SELL ANY SPECIFIC SECURITY, PAST PERFORMANCE IS NOT INDICATIVE OF FUTURE RESULTS. INVESTING INVOLVES RISK, INCLUDING THE POSSIBLE LOSS OF A PRINCIPAL INVESTMENT.
INDEX PERFORMANCE IS PRESENTED FOR ILLUSTRATIVE PURPOSES ONLY. DIRECT INVESTMENT CANNOT BE MADE INTO AN INDEX. INVESTMENT IN EQUITIES INVOLVES MORE RISK THAN OTHER SECURITIES AND MAY HAVE THE POTENTIAL FOR HIGHER RETURNS AND GREATER LOSSES. BONDS HAVE INTEREST RATE RISK AND CREDIT RISK. AS INTEREST RATES RISE, EXISTING BOND PRICES FALL AND CAN CAUSE THE VALUE OF AN INVESTMENT TO DECLINE. CHANGES IN INTEREST RATES GENERALLY HAVE A GREATER EFFECT ON BONDS WITH LONGER MATURITIES THAN ON THOSE WITH SHORTER MATURITIES. CREDIT RISK REFERES TO THE POSSIBLITY THAT THE ISSUER OF THE BOND WILL NOT BE ABLE TO MAKE PRINCIPAL AND/OR INTEREST PAYMENTS.
THE INFORMATION CONTAINED HEREIN HAS BEEN PREPARED TO ASSIST INTERESTED PARTIES IN MAKING THEIR OWN EVALUATION OF GFG CAPITAL AND DOES NOT PURPORT TO CONTAIN ALL OF THE INFORMATION THAT A PROSPECTIVE CLIENT MAY DESIRE. IN ALL CASES, INTERESTED PARTIES SHOULD CONDUCT THEIR OWN INVESTIGATION AND ANALYSIS OF GFG CAPITAL AND THE DATA SET FORTH IN THIS PRESENTATION. FOR A FULL DESCRIPTION OF GFG CAPITAL’S ADVISORY SERVICES AND FEES, PLEASE REFER TO OUR FORM ADV PART 2 DISCLOSURE BROCHURE AVAILABLE BY REQUEST OR AT THE FOLLOWING WEBSITE: HTTP://WWW.ADVISERINFO.SEC.GOV/.
ALL COMMUNICATIONS, INQUIRIES AND REQUESTS FOR INFORMATION RELATING TO THIS PRESENTATION SHOULD BE ADDRESSED TO GFG CAPITAL AT 305-810-6500.