

There’s been a lot of buzz about factor rotations lately. Here’s the punchline: no one knows how long they last, and no risk model is perfect. That’s what makes them so exciting—and dangerous.
What’s A Factor, Anyway?
So, what is a “factor”? My definition is “any attribute that you can group by and is persistent over time.” Traditional Fama-French factors like Size and Momentum are examples, but factors can also emerge from events, like the “Work from Home” factor during COVID. I believe in further grouping factors. Here’s where it gets critical: people often mix up descriptive factors with causal factors.
Descriptive Factors: These are attributes that describe groups and can drive performance over time, as demonstrated by models like Fama-French. They can influence long-term trends and overall performance but might not necessarily dictate short-term price movements.
Causal Factors: These are attributes that have a direct impact on performance and can influence short-term price movements. Forward earnings revisions, for instance, can directly affect stock prices and provide immediate insights.
Confusing descriptive and causal factors can lead to a quick demise in the markets if you manage money.
Factor Rotations: Market Musical Chairs
Factor rotations occur when money shifts from one defined group to another—think Growth to Value, or WFH to cyclical recovery names. This can wreak havoc on long/short (L/S) books both directly (longs down, shorts up) and indirectly (vibrations from others de-grossing). It’s impossible to 100% hedge any factor. Claiming to do so shows a hubris that the market will quickly humble. If you could perfectly hedge, you’d be able to predict the future, and hedging wouldn’t be necessary.
Exposure Management: The Balancing Act
For any risk manager, understanding your portfolio’s composition and the bets you’re making is crucial. Here’s how to approach it:
Descriptive Analysis: Conduct a thorough descriptive analysis of your portfolio. Use a mix of traditional and custom factors to gain real-time insights. The biggest fear is a hidden bet rearing its ugly head at the wrong time. Know what you own and understand your contributions to risk.
Managing Exposures: Once you understand your exposures, you can decide what to do. If Momentum contributes 20% of your risk, you can reduce longs, increase shorts, or remove the momentum factor altogether. These decisions can save years in tough periods.
Handling Factor Rotations: This combines experience (often from getting crushed in rotations) and continuously probing your portfolio. The best PMs know what they own, understand macro conditions, have views on individual names, and make probabilistic bets on the future. Identifying a catalyst before it happens or reacting swiftly afterward is key. Ask yourself daily: What are the first principles of crowded trades? What would prompt people to sell these trades? Is there anything upcoming I should consider?
Custom Factors: Decoding Market Language
Custom factors provide a more nuanced view of the market and can give you an edge. Here are a few examples:
Profitability: Tracking companies with high and sustainable profitability can be a strong indicator of long-term performance.
AI Revenue Exposure: Companies with significant revenue tied to artificial intelligence technologies may offer unique growth opportunities as AI continues to expand.
Supply Chain Risk: This factor looks at companies heavily reliant on complex global supply chains. It became particularly relevant during COVID-19 and can predict vulnerabilities in supply disruptions.
Patent Activity: Tracking the number and impact of patents filed by a company can be a leading indicator of future growth and innovation.
Customer Sentiment: Analyzing social media and review data to gauge customer sentiment can provide early signals about a company’s performance and market perception.
Regulatory Risk: This factor assesses the potential impact of upcoming regulations on different sectors, helping predict which industries might face headwinds or tailwinds.
Defend Your Portfolio Like A Pro
In the realm of factor rotations, defensive strategies are paramount. Here are some key approaches:
Diversification: Spread your bets across various factors to reduce the impact of any single factor rotation.
Hedging: Use derivatives and other instruments to hedge against specific risks. While you can’t hedge perfectly, you can mitigate some of the risks.
Liquidity Management: Ensure you have enough liquidity to react quickly to unexpected changes. This might mean holding more cash or highly liquid assets during uncertain times.
Continuous Monitoring: Regularly review and adjust your portfolio based on the latest data and market conditions. Stay agile and ready to pivot when necessary.
The Art of Timing Factor Rotations
Timing factor rotations can be incredibly challenging, but here are a few tips to improve your chances:
Analyze Historical Patterns: Study past rotations to understand typical durations and triggers. While history doesn’t repeat itself exactly, it often rhymes.
Monitor Macro Indicators: Keep a close eye on economic indicators, interest rates, and policy changes. These can provide early signals of shifts in market sentiment and factor performance.
Sentiment Analysis: Use tools to gauge market sentiment from news, social media, and analyst reports. Changes in sentiment can precede shifts in factor performance.
Valuation Metrics: Pay attention to valuation spreads between factors. When certain factors become extremely over or undervalued relative to others, a rotation might be imminent.
Liquidity and Volume: Watch for changes in trading volume and liquidity in specific sectors or factors. Sudden spikes can indicate the start of a rotation.
Stay Agile: Be prepared to adjust your positions quickly. Factor rotations can happen fast, and being nimble can help you capitalize on opportunities or mitigate risks.
Reading the Market’s Mood Swings
Looking at the recent thematic rotations over the last 5 days ending July 19th, several notable trends and shifts emerge[1]:
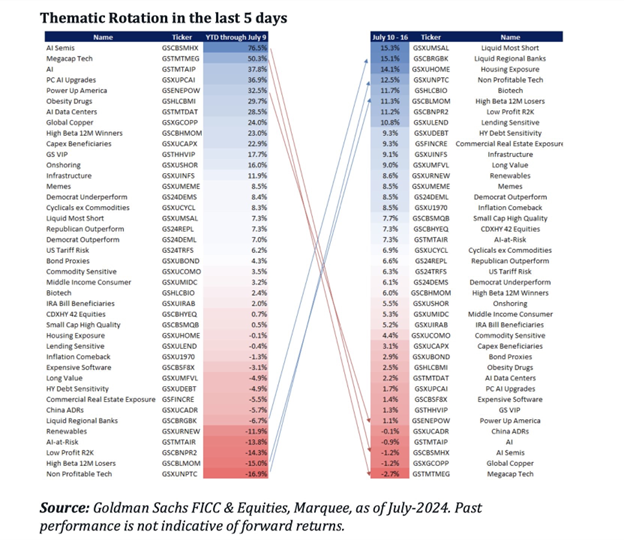
[1] Chart provided by Goldman Sachs, data as of 07/19/2024.
AI and Technology: AI Semis, Megacap Tech, and AI-related factors have experienced significant rotations. While they had strong year-to-date performance, the recent 5-day period shows a shift out of these names. For instance, AI Semis and AI have dropped from leading positions to the lower end of performance, indicating a rotation away from these high-flying sectors.
Resilience in Defensive Plays: Liquid Most Short and Liquid Regional Banks have moved to the top in the last 5 days, reflecting a shift towards more defensive and safer plays amid market uncertainty. This suggests that investors are seeking stability and lower risk exposure in the short term.
Sector Rotations: Sectors like Biotech and Housing Sensitive have seen mixed movements, with some like Biotech moving up the ranks, while Housing Sensitive showed notable declines. This indicates selective sector rotations based on specific macro or micro factors influencing these industries.
Performance of High Beta and Volatility Factors: High Beta 12M Losers and Low Profit R2K have shown negative performance in the recent period. This rotation away from high beta and volatile names suggests a risk-off sentiment prevailing in the market.
Interest in Cyclicals and Commodities: Cyclicals ex Commodities and Commodity Sensitive have maintained relatively stable positions, showing some resilience. This indicates that despite the broader rotations, there is still some investor interest in cyclical recovery plays.
Additionally, recent data shows a notable shift based on short interest as a percentage of float in the Russell 3000. The decile of stocks with the highest short interest has seen a significant average increase of 15.7% since July 9th, indicating a short squeeze effect. This reflects how quickly market dynamics can change and highlights the importance of monitoring short interest levels as part of your factor analysis [2].
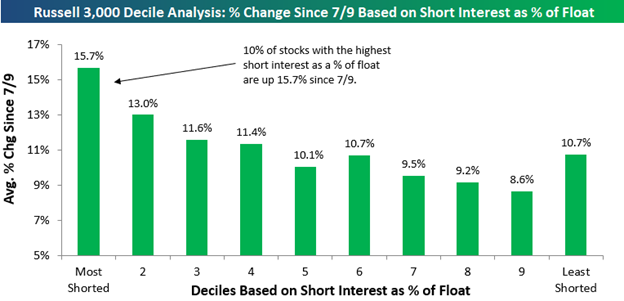
[2] Chart provided by Bespoke.
Economic and Political Context: The Trump Trade Redux
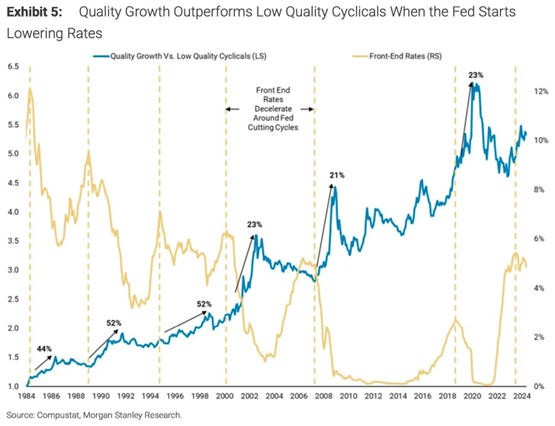
As a reminder to everybody, when you reach this point of the economic and rate cycle, quality growth outperforms. The violent shift from growth to value, and megacaps to small-caps, is being dubbed the “Trump Trade” given the former President’s rising odds of reclaiming the keys to the White House. In his prior four-year term, growth crushed value by 72 percentage points, and large-caps beat small-caps by 22 percentage points. This is yet another classic case of pundits constantly trying to fit a narrative to the price action[3].
[3] Data provided by Bloomberg database.
[4] Chart provided by Morgan Stanley.
Final Thoughts: Stay Nimble, Stay Ahead
In the ever-turbulent landscape of factor rotations, the key to success lies in vigilance and adaptability. The market’s capricious nature means that no strategy remains foolproof for long. Continuously reevaluate your portfolio, harness both traditional and custom factors, and remain agile in your approach. Market movements are driven by a mix of fundamentals and ever-changing narratives. By staying informed and flexible, you can turn the inherent volatility into an advantage. Keep your insights sharp, your strategies dynamic, and your perspective broad—because in finance, change is the only constant.
LEGAL STUFF
CURRENT MARKET DATA IS AS OF 7/23/2024. OPINIONS AND PREDICTIONS ARE AS OF 7/23/2024 AND ARE SUBJECT TO CHANGE AT ANY TIME BASED ON MARKET AND OTHER CONDITIONS. NO PREDICTIONS OR FORECASTS CAN BE GUARANTEED. INFORMATION CONTAINED HEREIN HAS BEEN OBTAINED FROM SOURCES BELIEVED TO BE RELIABLE BUT IS NOT GUARANTEED.
THIS PRESENTATION (THE “PRESENTATION”) HAS BEEN PREPARED SOLELY FOR INFORMATION PURPOSES AND IS NOT INTENDED TO BE AN OFFER OR SOLICITATION AND IS BEING FURNISHED SOLELY FOR USE BY CLIENTS AND PROSPECTIVE CLIENTS IN CONSIDERING GFG CAPITAL, LLC (“GFG CAPITAL” OR THE “COMPANY”) AS THEIR INVESTMENT ADVISER. DO NOT USE THE FOREGOING AS THE SOLE BASIS OF INVESTMENT DECISIONS. ALL SOURCES DEEMED RELIABLE HOWEVER GFG CAPITAL ASSUMES NO RESPONSIBILITY FOR ANY INACCURACIES. THE OPINIONS CONTAINED HEREIN ARE NOT RECOMMENDATIONS.
THIS MATERIAL DOES NOT CONSTITUTE A RECOMMENDATION TO BUY OR SELL ANY SPECIFIC SECURITY, PAST PERFORMANCE IS NOT INDICATIVE OF FUTURE RESULTS. INVESTING INVOLVES RISK, INCLUDING THE POSSIBLE LOSS OF A PRINCIPAL INVESTMENT.
INDEX PERFORMANCE IS PRESENTED FOR ILLUSTRATIVE PURPOSES ONLY. DIRECT INVESTMENT CANNOT BE MADE INTO AN INDEX. INVESTMENT IN EQUITIES INVOLVES MORE RISK THAN OTHER SECURITIES AND MAY HAVE THE POTENTIAL FOR HIGHER RETURNS AND GREATER LOSSES. BONDS HAVE INTEREST RATE RISK AND CREDIT RISK. AS INTEREST RATES RISE, EXISTING BOND PRICES FALL AND CAN CAUSE THE VALUE OF AN INVESTMENT TO DECLINE. CHANGES IN INTEREST RATES GENERALLY HAVE A GREATER EFFECT ON BONDS WITH LONGER MATURITIES THAN ON THOSE WITH SHORTER MATURITIES. CREDIT RISK REFERES TO THE POSSIBLITY THAT THE ISSUER OF THE BOND WILL NOT BE ABLE TO MAKE PRINCIPAL AND/OR INTEREST PAYMENTS.
THE INFORMATION CONTAINED HEREIN HAS BEEN PREPARED TO ASSIST INTERESTED PARTIES IN MAKING THEIR OWN EVALUATION OF GFG CAPITAL AND DOES NOT PURPORT TO CONTAIN ALL OF THE INFORMATION THAT A PROSPECTIVE CLIENT MAY DESIRE. IN ALL CASES, INTERESTED PARTIES SHOULD CONDUCT THEIR OWN INVESTIGATION AND ANALYSIS OF GFG CAPITAL AND THE DATA SET FORTH IN THIS PRESENTATION. FOR A FULL DESCRIPTION OF GFG CAPITAL’S ADVISORY SERVICES AND FEES, PLEASE REFER TO OUR FORM ADV PART 2 DISCLOSURE BROCHURE AVAILABLE BY REQUEST OR AT THE FOLLOWING WEBSITE: HTTP://WWW.ADVISERINFO.SEC.GOV/.
ALL COMMUNICATIONS, INQUIRIES AND REQUESTS FOR INFORMATION RELATING TO THIS PRESENTATION SHOULD BE ADDRESSED TO GFG CAPITAL AT 305-810-6500.