

Since the spring of 2022, believe it or not, volatility (as measured by the VIX) has been in decline. Seriously, for about two and a half years, we experienced a higher volatility regime that peaked in April 2022 (see the VIX chart below). Volatility tends to cluster, and absent an unforeseen catalyst, it often clusters at the lower end of its expected range. Naturally, if or when a catalyst appears out of the blue, forward expectations for volatility trend higher. This concept is self-reinforcing: unexpected events cause volatility expectations to spike, and when volatility is high, more unexpected events can occur. In the past week, we’ve seen unprecedented events: an assassination attempt on a former U.S. President (and current Presidential candidate), while his main opposition (the current sitting first-term President) has bowed out of the race. Such unforeseen and unprecedented events can significantly impact volatility. So, let’s take a look at the current state of volatility and how investors might interpret it.
All’s Quiet on The Volatility Front
You can observe the later stages of the post-GFC low-volatility regime in the chart below, including the 2020 pandemic vol-spike and the subsequent high-volatility regime that followed. Notably, just a few months before the peak CPI print in June 2022, volatility began to trend lower on a monthly closing basis and has shown little reversion since[1].
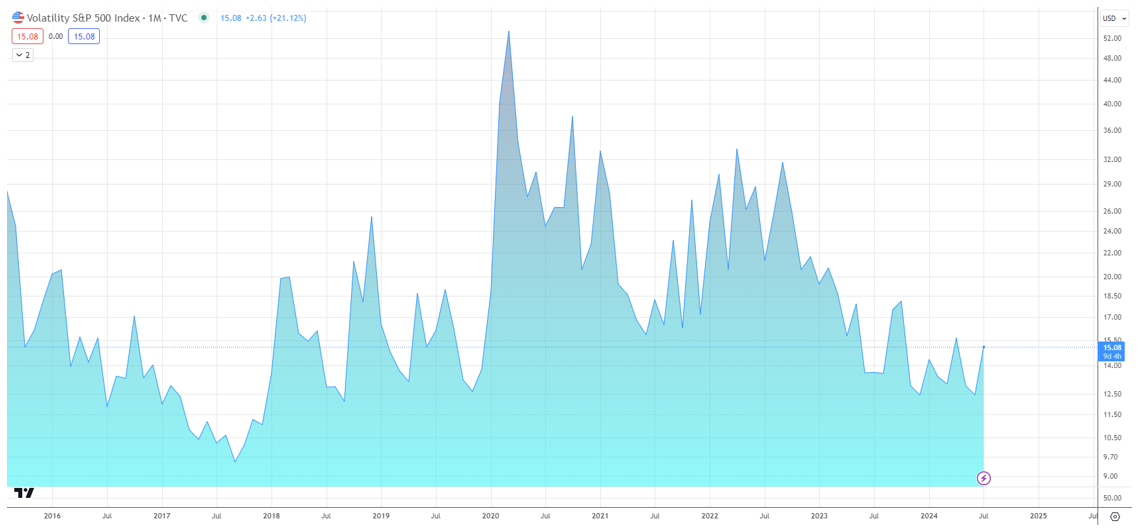
[1] Chart provided by TradingView.com The VIX Index is a calculation designed to produce a measure of constant, 30-day expected volatility of the U.S. stock market, derived from real-time, mid-quote prices of S&P 500® Index (SPX℠) call and put options. On a global basis, it is one of the most recognized measures of volatility — widely reported by financial media and closely followed by a variety of market participants as a daily market indicator. The performance of an index is not an exact representation of any particular investment, as you cannot invest directly in an index.
In fact, there hasn’t been a daily, weekly, or monthly close price on the VIX of 20 since March 2023. This is significant because the average VIX reading has been 20 since its introduction in 1990, with a standard deviation of +/- 8. Even with the recent spike in volatility over the past week, the VIX has struggled to break above 16, remaining about 40% below its one-year high. Interestingly, the market reacted more sensitively to the global IT error on July 19th than it did to the assassination attempt or Joe Biden’s withdrawal from the race. This should remind investors to avoid attaching narratives to market moves.
We are currently in a seasonal period where things are very quiet, making the market more susceptible to nonsensical headlines and narratives due to light liquidity. This is a pattern we see every summer. Although volatility may cluster at low levels, this is the environment where it can be abnormally jumpy and reactive yet remain low. For 99% of the world, this doesn’t matter.
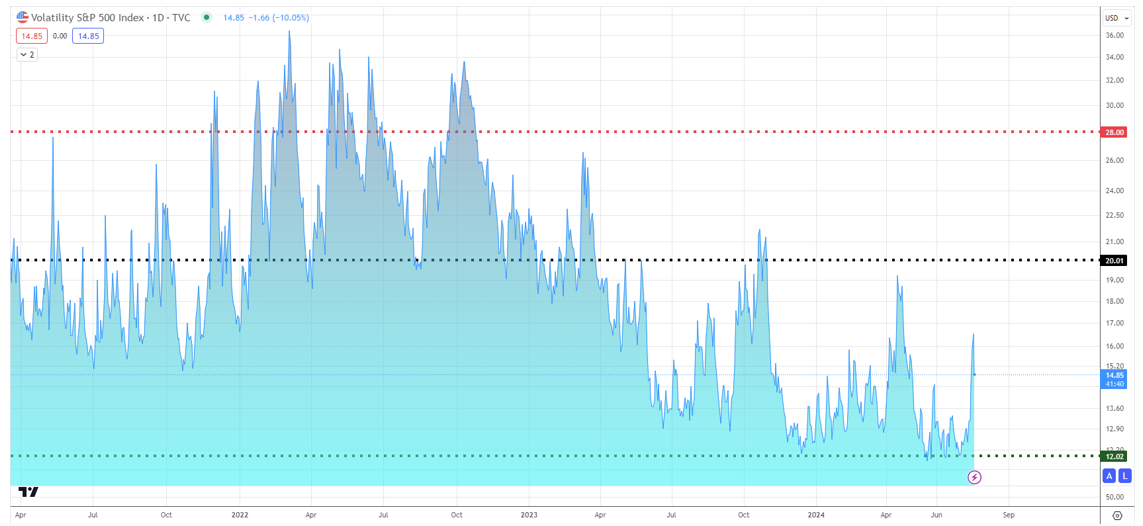
With the seasonal sensitivity in mind, we’re back on VIX watch to gauge when the selloff in US equities may reach a tradeable low. The VIX ended Friday (July 19th) at 16.5, marking its highest close since April 22nd. On that date, the S&P 500 had just completed a 5.5% pullback from its March month-end highs. Currently, the S&P is only 2.8% off its most recent high from July 16th[2]. The fact that we’re seeing elevated VIX levels without even a 3% pullback suggests that US large-cap stocks could face further pressure in the coming weeks. Thus, examining long-run VIX levels and their impact on trading this year becomes essential. Here’s a look at the VIX on a daily interval with the average (middle dotted line) and 1 standard deviation readings (red top, green bottom) [3]:
[2] Data provided by Bloomberg database. The VIX Index is a calculation designed to produce a measure of constant, 30-day expected volatility of the U.S. stock market, derived from real-time, mid-quote prices of S&P 500® Index (SPX℠) call and put options. On a global basis, it is one of the most recognized measures of volatility — widely reported by financial media and closely followed by a variety of market participants as a daily market indicator. The performance of an index is not an exact representation of any particular investment, as you cannot invest directly in an index.
[3] Chart provided by TradingView.com
Historically, since its inception in January 1990, the VIX has averaged a daily close of 19.5, typically acting as a floor during bear markets and a ceiling during bull markets. Over the past 12 months, we’ve witnessed two notable peaks in the VIX: 21.7 on October 20th, 2023, and 19.2 on April 15th, 2024. The S&P 500 bottomed shortly after these peaks, with final drawdowns reaching a trough of 10.3% and 5.3%, respectively, occurring 7 and 4 days after peak VIX levels.
This recent history indicates that a VIX close between 19.2 and 21.7, aligning with its long-term average, might signal a favorable entry point into US large caps. If you anticipate a more severe market downturn, keep an eye on the VIX reaching 27, one standard deviation above the long-term mean.
While stretched VIX levels to the upside tend to lead to above-average equity returns on a forward-looking basis, we wouldn’t encourage investors to try and game their equity exposure based solely on VIX readings. A quiet VIX has historically provided a higher floor for equity returns with an equally positive skew.
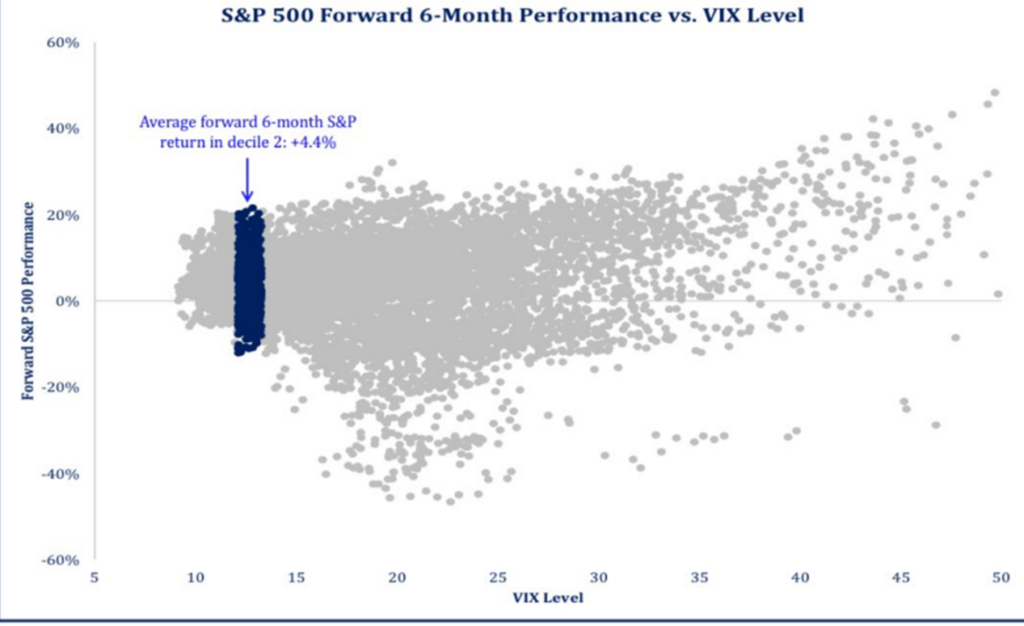
[4] Chart provided by Strategis ETFs
As we navigate these turbulent times, it’s crucial to remember that volatility is an inherent part of market dynamics. The current period of low VIX readings, despite recent geopolitical shocks, underscores the market’s resilience and the complex interplay of factors influencing investor sentiment. While the temptation to time the market based on VIX levels can be strong, it’s a strategy fraught with risks. Instead, maintaining a long-term perspective and focusing on fundamentals will serve investors better in the long run. As always, we’ll continue to monitor the VIX and other market indicators, keeping you informed of any significant developments. Stay patient, stay informed, and avoid the noise.
LEGAL STUFF
CURRENT MARKET DATA IS AS OF 7/21/2024. OPINIONS AND PREDICTIONS ARE AS OF 7/21/2024 AND ARE SUBJECT TO CHANGE AT ANY TIME BASED ON MARKET AND OTHER CONDITIONS. NO PREDICTIONS OR FORECASTS CAN BE GUARANTEED. INFORMATION CONTAINED HEREIN HAS BEEN OBTAINED FROM SOURCES BELIEVED TO BE RELIABLE BUT IS NOT GUARANTEED.
THIS PRESENTATION (THE “PRESENTATION”) HAS BEEN PREPARED SOLELY FOR INFORMATION PURPOSES AND IS NOT INTENDED TO BE AN OFFER OR SOLICITATION AND IS BEING FURNISHED SOLELY FOR USE BY CLIENTS AND PROSPECTIVE CLIENTS IN CONSIDERING GFG CAPITAL, LLC (“GFG CAPITAL” OR THE “COMPANY”) AS THEIR INVESTMENT ADVISER. DO NOT USE THE FOREGOING AS THE SOLE BASIS OF INVESTMENT DECISIONS. ALL SOURCES DEEMED RELIABLE HOWEVER GFG CAPITAL ASSUMES NO RESPONSIBILITY FOR ANY INACCURACIES. THE OPINIONS CONTAINED HEREIN ARE NOT RECOMMENDATIONS.
THIS MATERIAL DOES NOT CONSTITUTE A RECOMMENDATION TO BUY OR SELL ANY SPECIFIC SECURITY, PAST PERFORMANCE IS NOT INDICATIVE OF FUTURE RESULTS. INVESTING INVOLVES RISK, INCLUDING THE POSSIBLE LOSS OF A PRINCIPAL INVESTMENT.
INDEX PERFORMANCE IS PRESENTED FOR ILLUSTRATIVE PURPOSES ONLY. DIRECT INVESTMENT CANNOT BE MADE INTO AN INDEX. INVESTMENT IN EQUITIES INVOLVES MORE RISK THAN OTHER SECURITIES AND MAY HAVE THE POTENTIAL FOR HIGHER RETURNS AND GREATER LOSSES. BONDS HAVE INTEREST RATE RISK AND CREDIT RISK. AS INTEREST RATES RISE, EXISTING BOND PRICES FALL AND CAN CAUSE THE VALUE OF AN INVESTMENT TO DECLINE. CHANGES IN INTEREST RATES GENERALLY HAVE A GREATER EFFECT ON BONDS WITH LONGER MATURITIES THAN ON THOSE WITH SHORTER MATURITIES. CREDIT RISK REFERES TO THE POSSIBLITY THAT THE ISSUER OF THE BOND WILL NOT BE ABLE TO MAKE PRINCIPAL AND/OR INTEREST PAYMENTS.
THE INFORMATION CONTAINED HEREIN HAS BEEN PREPARED TO ASSIST INTERESTED PARTIES IN MAKING THEIR OWN EVALUATION OF GFG CAPITAL AND DOES NOT PURPORT TO CONTAIN ALL OF THE INFORMATION THAT A PROSPECTIVE CLIENT MAY DESIRE. IN ALL CASES, INTERESTED PARTIES SHOULD CONDUCT THEIR OWN INVESTIGATION AND ANALYSIS OF GFG CAPITAL AND THE DATA SET FORTH IN THIS PRESENTATION. FOR A FULL DESCRIPTION OF GFG CAPITAL’S ADVISORY SERVICES AND FEES, PLEASE REFER TO OUR FORM ADV PART 2 DISCLOSURE BROCHURE AVAILABLE BY REQUEST OR AT THE FOLLOWING WEBSITE: HTTP://WWW.ADVISERINFO.SEC.GOV/.
ALL COMMUNICATIONS, INQUIRIES AND REQUESTS FOR INFORMATION RELATING TO THIS PRESENTATION SHOULD BE ADDRESSED TO GFG CAPITAL AT 305-810-6500.