

Cash Deployment: A Framework for Seizing Market Opportunities
One of the perennial challenges in portfolio management is not just holding cash, but knowing when to put it to work. Cash is an option, not an answer. In a normalized environment, holding cash comes with a visible opportunity cost. But in today’s market, the flexibility to redeploy can be a critical advantage — provided we have a framework for when and how to do so.
Rather than rely on gut feel or arbitrary triggers, we lean on a triangulated approach that blends three distinct indicators: sentiment extremes, valuation multiples, and recessionary pricing. These three signals, used in combination, increase the odds of redeploying cash at points of maximum opportunity — and minimum regret.
Signs of Panic: Sentiment and Positioning Capitulation
Market bottoms are rarely polite affairs. They arrive with the unmistakable scent of panic: volatility spikes, investor surveys drenched in pessimism, and positioning data showing risk aversion at extremes. Our first signal draws from indicators like the VIX, which in panic moments functions less as a volatility measure and more as a barometer of fear.
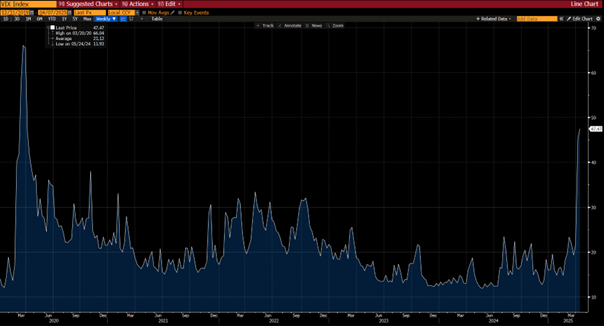
[1] Chart provided by Bloomberg database.
The VIX’s relationship with forward returns offers a compelling illustration of contrarian signals at work. As the Schroders data shows, when the VIX reaches elevated levels above 28, particularly when it exceeds 33, subsequent 12-month S&P 500 returns have historically been exceptional. This pattern is intuitive: peaks in volatility often coincide with capitulation selling and maximum uncertainty.
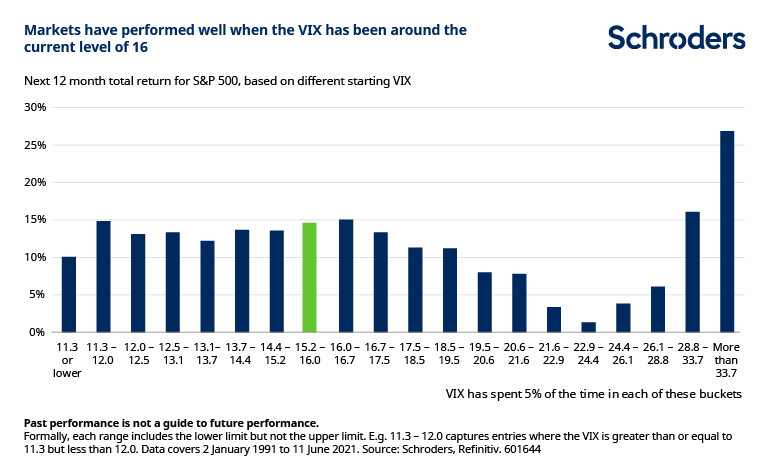
[2] Chart provided by Schroders.
What’s notable here isn’t just the magnitude of returns following high-VIX periods but the consistency of the relationship. The data demonstrates a generally inverse correlation between volatility and future performance across the spectrum. When markets price in calm (VIX below 15), forward returns tend toward the average. But when fear dominates pricing (VIX above 28), the potential opportunity set expands significantly.
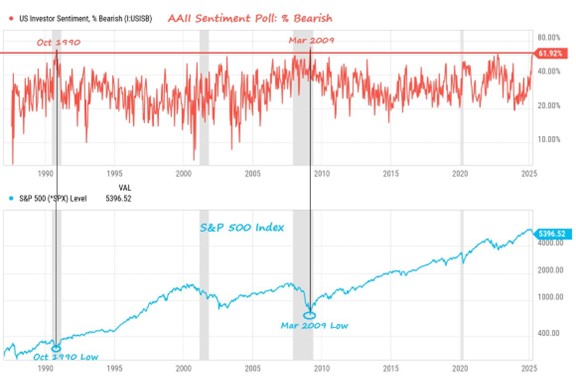
Complementing this, the AAII investor sentiment surveys tend to spike in bearishness well after market declines have taken hold. Similarly, fund manager positioning surveys reveal when professionals have already de-risked aggressively. The goal is simple: wait for signs that panic has done its work. If fear is a finite resource, these indicators help tell us when the market has exhausted its supply.
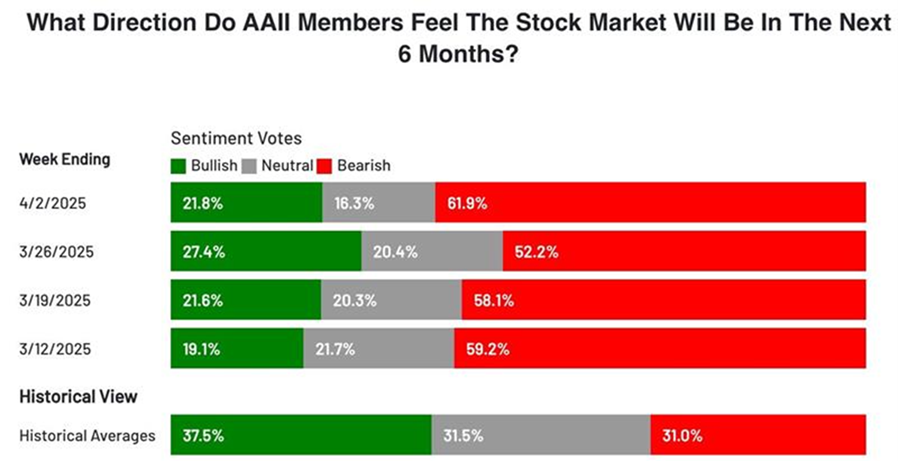
[3] Chart provided by AAII
[4] Chart provided by Creative Planning, YCharts
Discounted Multiples vs. Long-Run Averages
While sentiment tells us about flow, valuation tells us about price. Our second indicator examines prevailing Forward P/E multiples against their long-term averages. In the current environment, we’re watching for the moment when prices detach from fundamentals and multiples compress below historical norms.
This isn’t about calling the bottom tick; it’s about recognizing when the market stops pricing in optimism of any kind. By anchoring to long-term valuation histories, we gain context for whether the current selloff has meaningfully reset expectations. Importantly, this indicator works best alongside sentiment — cheap can always get cheaper if fear hasn’t yet peaked.
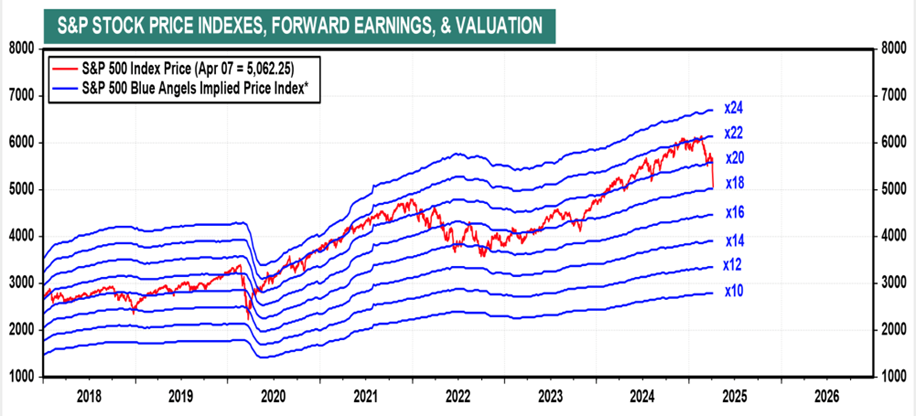
[5] Cart provided by Yardeni Research
The chart above reveals a crucial insight: the market typically finds equilibrium at mid-teen multiples during periods of uncertainty. These levels represent the discount at which investors have historically re-engaged after significant risk repricing.
Recessionary Trough Multiples
Our final indicator is the most severe: are markets pricing in not just multiple contraction but actual earnings deterioration consistent with recession? Not every selloff coincides with recession, but when both valuation compression and earnings contraction converge, we reach the zone of maximum opportunity.
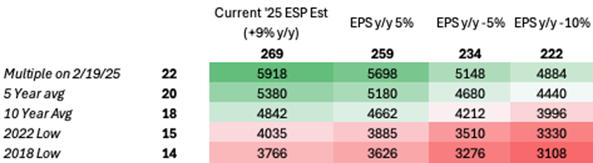
[6] Data provided by Bloomberg database.
This earnings sensitivity matrix illustrates the point. At January’s 22x multiple, even a recessionary earnings scenario of $220 would imply only a 13% downside from current levels. Yet historical averages suggest more substantial adjustments. At historical recession-level multiples (16-18x), this same earnings deterioration would drive 29-37% drawdowns.
With S&P 500 EPS growth estimates already reduced from +15% to +9% for the full year, we must question whether consensus estimates remain too optimistic for a true recessionary scenario. When markets eventually price both multiple compression and earnings deterioration (the red zones), we find the sweet spot for deploying cash.
Conclusion
No single indicator works in isolation. But when these three converge in today’s market — volatility spiking alongside extreme bearish sentiment, multiples compressing well below long-term averages, and prices reflecting genuine earnings deterioration — the balance of probabilities shifts decisively in favor of action.
This disciplined approach to cash deployment is structured, historically grounded, and designed specifically for navigating the current environment. As always, the hard part isn’t knowing the signals. It’s trusting them in real time.
IMPORTANT LEGAL DISCLOSURES
CURRENT MARKET DATA IS AS OF 04/07/2025. OPINIONS AND PREDICTIONS ARE AS OF 04/07/2025 AND ARE SUBJECT TO CHANGE AT ANY TIME BASED ON MARKET AND OTHER CONDITIONS. NO PREDICTIONS OR FORECASTS CAN BE GUARANTEED. INFORMATION CONTAINED HEREIN HAS BEEN OBTAINED FROM SOURCES BELIEVED TO BE RELIABLE BUT IS NOT GUARANTEED.
THIS PRESENTATION (THE “PRESENTATION”) HAS BEEN PREPARED SOLELY FOR INFORMATION PURPOSES AND IS NOT INTENDED TO BE AN OFFER OR SOLICITATION AND IS BEING FURNISHED SOLELY FOR USE BY CLIENTS AND PROSPECTIVE CLIENTS IN CONSIDERING GFG CAPITAL, LLC (“GFG CAPITAL” OR THE “COMPANY”) AS THEIR INVESTMENT ADVISER. DO NOT USE THE FOREGOING AS THE SOLE BASIS OF INVESTMENT DECISIONS. ALL SOURCES DEEMED RELIABLE HOWEVER GFG CAPITAL ASSUMES NO RESPONSIBILITY FOR ANY INACCURACIES. THE OPINIONS CONTAINED HEREIN ARE NOT RECOMMENDATIONS.
THIS MATERIAL DOES NOT CONSTITUTE A RECOMMENDATION TO BUY OR SELL ANY SPECIFIC SECURITY, PAST PERFORMANCE IS NOT INDICATIVE OF FUTURE RESULTS. INVESTING INVOLVES RISK, INCLUDING THE POSSIBLE LOSS OF A PRINCIPAL INVESTMENT.
INDEX PERFORMANCE IS PRESENTED FOR ILLUSTRATIVE PURPOSES ONLY. DIRECT INVESTMENT CANNOT BE MADE INTO AN INDEX. INVESTMENT IN EQUITIES INVOLVES MORE RISK THAN OTHER SECURITIES AND MAY HAVE THE POTENTIAL FOR HIGHER RETURNS AND GREATER LOSSES. BONDS HAVE INTEREST RATE RISK AND CREDIT RISK. AS INTEREST RATES RISE, EXISTING BOND PRICES FALL AND CAN CAUSE THE VALUE OF AN INVESTMENT TO DECLINE. CHANGES IN INTEREST RATES GENERALLY HAVE A GREATER EFFECT ON BONDS WITH LONGER MATURITIES THAN ON THOSE WITH SHORTER MATURITIES. CREDIT RISK REFERES TO THE POSSIBLITY THAT THE ISSUER OF THE BOND WILL NOT BE ABLE TO MAKE PRINCIPAL AND/OR INTEREST PAYMENTS.
THE INFORMATION CONTAINED HEREIN HAS BEEN PREPARED TO ASSIST INTERESTED PARTIES IN MAKING THEIR OWN EVALUATION OF GFG CAPITAL AND DOES NOT PURPORT TO CONTAIN ALL OF THE INFORMATION THAT A PROSPECTIVE CLIENT MAY DESIRE. IN ALL CASES, INTERESTED PARTIES SHOULD CONDUCT THEIR OWN INVESTIGATION AND ANALYSIS OF GFG CAPITAL AND THE DATA SET FORTH IN THIS PRESENTATION. FOR A FULL DESCRIPTION OF GFG CAPITAL’S ADVISORY SERVICES AND FEES, PLEASE REFER TO OUR FORM ADV PART 2 DISCLOSURE BROCHURE AVAILABLE BY REQUEST OR AT THE FOLLOWING WEBSITE: HTTP://WWW.ADVISERINFO.SEC.GOV/.
ALL COMMUNICATIONS, INQUIRIES AND REQUESTS FOR INFORMATION RELATING TO THIS PRESENTATION SHOULD BE ADDRESSED TO GFG CAPITAL AT 305-810-6500.