If history teaches us anything about markets, it’s that every “wall of worry” has its bricks—some familiar, others rarely seen—and yet markets tend to climb it. As we look toward 2025, I want to address the questions that are top of mind for investors: Are we due for a “dud year”? Is corporate profitability sustainable at record levels? And after back-to-back double-digit gains, can the S&P 500 pull off another year of strength, or will some of the usual (and unusual) suspects knock equities off course? We’ll touch on all of this, but let’s start with a question we’ve been hearing more frequently.
Are We Headed for a “Dud Year”?
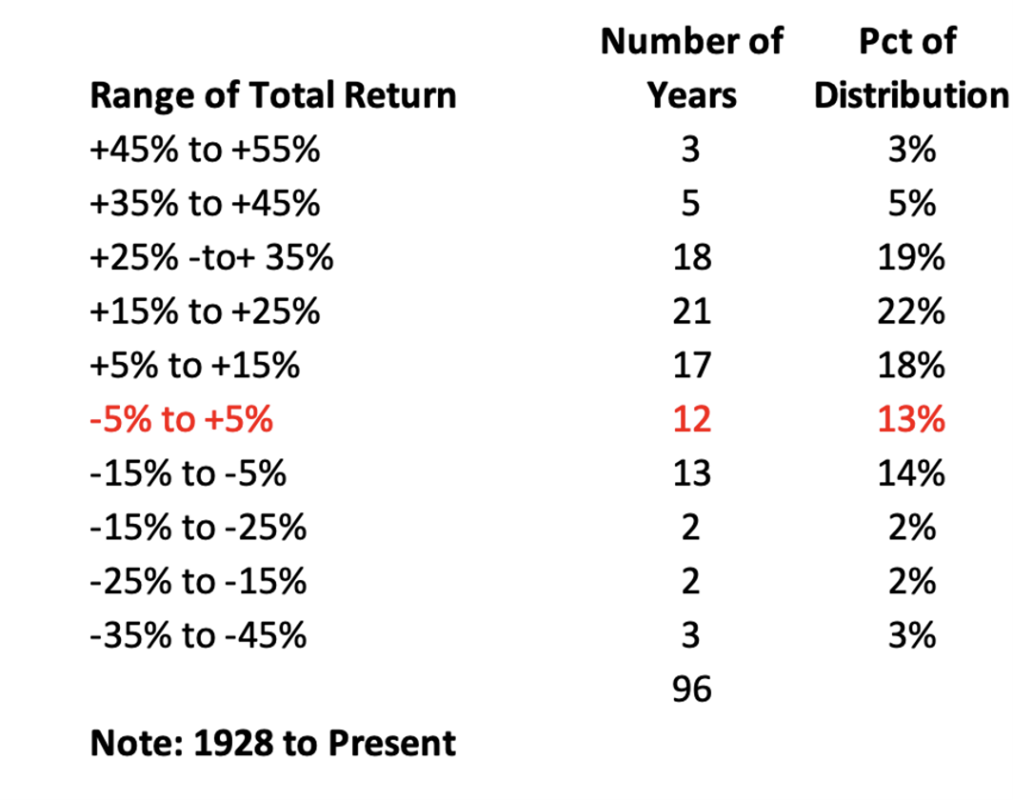
Much of the sentiment around the coming year for equities is anchored in the idea of a dud year for the S&P 500. A year where the S&P 500 posts a total return of -5% to +5% feels like the market equivalent of a shrug—a “meh” result in a world where investors have grown used to more dramatic swings. But history tells us these years are uncommon, though not as rare as you might think. Looking back to 1928, there have been 12 such years, or about 13% of all outcomes. Interestingly, the more familiar “mildly negative” range of -15% to -5% occurred just slightly more often, accounting for 14% of all years1:

But here’s where things get interesting: Dud years have become more frequent since the 1990s, with six of them occurring since 1990 alone—years like 1994 (+1.3%), 2011 (+2.1%), 2015 (+1.4%), and 2018 (-4.2%). Why? In most cases, the culprit has been an unexpected hawkish shift by the Federal Reserve (1994, 2005, 2018) or a global growth scare (2011, 2015).3
What does that mean for 2025? If we’re going to tread water, the likely catalysts are familiar: a Fed pivot to tighter policy, an oil-driven geopolitical shock, or renewed anxiety over global demand. But there’s good news, too. History suggests that “meh” years tend to set the stage for better performance. Since 1928, the average return in the year after a dud has been 24.3%, with only one subsequent down year (1940).4
While we don’t expect 2025 to be a “meh” year, it’s worth remembering that even when the S&P stalls, it has often done so in the face of events that might otherwise have caused outright bear markets.
[1-4] Data provided by Bloomberg Database.
Profitability at 12%: A Structural Shift or a High-Water Mark?
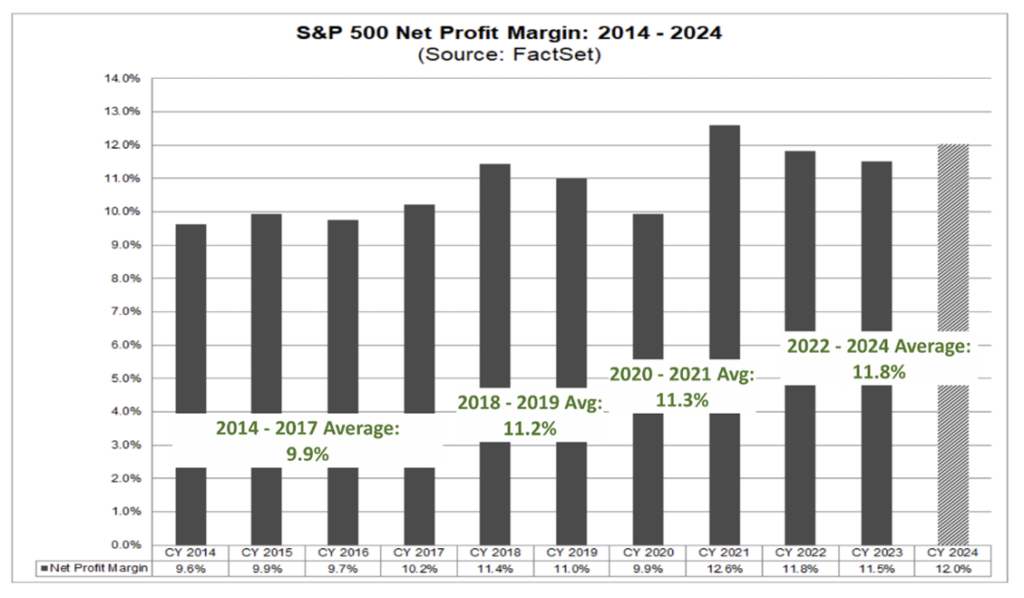
If you want to know why the S&P 500 trades at 22x earnings today versus 16x in 2014, look no further than corporate profitability. Since 2014, the index’s net profit margins have quietly but consistently improved, from an average of 9.9% between 2014 and 2017 to an expected 12.0% in 2024.5
The reasons are well-documented: post-2017 corporate tax cuts, operational efficiencies, and a post-pandemic shift in corporate cost structures. Margins briefly dipped in 2020 as the world shut down but quickly rebounded, averaging 11.8% over the last three years.6
Some might argue that margins this high are unsustainable. Maybe. But if a company increased its net margins by 20% over a decade—from 10% to 12%—no one would blink if its stock traded at a higher valuation. The same logic applies to the market as a whole. Higher margins mean higher returns on capital, signaling increased competitive advantage and, by extension, higher equity valuations.
In considering equity market valuations today, it’s essential to evaluate not only the absolute levels but also the evolving composition and quality of the S&P 500. The index of 2024 is fundamentally different from its counterparts in the 1980s and 1990s, reflecting profound transformations in sector representation, profit margin profiles, and global integration.
Back in the 1980s, the S&P 500 was dominated by industrials, energy, and consumer staples. Industrials alone comprised nearly 15% of the index, while Information Technology was a mere 6%. Capital-intensive industries constrained net profit margins to an average of 6% to 7%. Even into the 1990s, while margins crept up to 7% to 8%, traditional sectors like Industrials and Financials continued to anchor the index, limiting further margin expansion.7
Fast forward to today, and the story is dramatically different. Asset-light, high-margin sectors like Technology and Healthcare dominate, with Information Technology alone accounting for 30% of the index—over four times its weighting in the 1980s. Energy, once a powerhouse, has dwindled to just 4%. This evolution has structurally elevated profitability, pushing net margins above 12% in 2024. Companies that dominate the top of the index weighting exemplify this shift, leveraging global reach, low marginal costs, and scalability to redefine operational efficiency.8
Globalization further decouples the S&P 500 from traditional domestic indicators like GDP. The largest index constituents derive much of their revenue from international markets, tapping into faster-growing economies while optimizing supply chains. These dynamics—combined with advancements in automation and data-driven efficiencies—have fundamentally altered the earning power of the index.
The bottom line: Today’s S&P 500 warrants a higher valuation multiple than in decades past. Historical measures like the Buffett Indicator (U.S. equity market capitalization divided by GDP) often miss these structural changes. What once seemed expensive now reflects the superior quality, diversification, and earning power of globally dominant, margin-rich businesses. This is not the same index of the 1980s or 1990s—it is a far more profitable, efficient, and globally integrated benchmark.
Of course, the right time to consider bearish arguments is when things are going well, and the current environment certainly fits that description. If margins hold steady, valuations can remain where they are. If they contract, the math changes quickly.
[5-8] Data provided by Bloomberg Database.
What Could Go Wrong in 2025?
Every market cycle has its usual suspects, and 2025 is no different. Topping the list:
Geopolitical shocks—Chinese action against Taiwan would be the obvious candidate here, though oil shocks remain the historical template (1973, 1979, 1990).
Resurgent inflation—If inflation reaccelerates and forces the Fed to reverse its current bias toward easing, the 2022 playbook comes back into focus: higher rates, lower equity valuations.
Global growth scares—The stronger dollar is worth watching here. A gradual rally in the greenback can be managed, but a sudden spike could threaten global demand.
Then there are the less-discussed risks— “bricks” in the wall of worry that investors rarely see coming: fraud at high-profile companies, “founder risk” in businesses that rely on a single individual, or an unexpected collapse in virtual currency valuations. History tells us these are low-probability events, but when they happen, they leave a mark. Even if it’s just temporary.
Two policy issues in particular—tariffs and immigration reform—could challenge the corporate profitability and economic dynamism that underpin today’s elevated multiples.
Tariffs present a dual threat to the current economic environment. On one hand, higher tariffs on imports can increase input costs for businesses, particularly in manufacturing, consumer goods, and technology supply chains. Companies that rely on globalized production models—a hallmark of the modern S&P 500—could face margin compression as they absorb higher costs or pass them along to consumers. Historically, periods of protectionism have disrupted corporate efficiency and global trade flows, dampening both revenue growth and investor sentiment. For an index that derives substantial revenue from international markets, this risk is magnified.
Immigration reform poses a more subtle, yet equally consequential challenge. The U.S. has long benefitted from a dynamic labor force fueled by immigration, particularly in industries like technology, healthcare, and services. Immigrants make up a disproportionate share of highly skilled workers in STEM fields, which are essential to the growth and competitiveness of today’s asset-light, innovation-driven companies. Restrictive immigration policies could lead to labor shortages, increased wage pressures, and a slowdown in innovation—undermining two critical advantages that have fueled margin expansion and market leadership for U.S. corporations.
These policy risks highlight a key tension for investors: while the structural changes in sector composition and global reach justify higher valuation multiples, the resilience of the S&P 500 depends on maintaining an environment that supports corporate profitability and economic growth. Tariffs and restrictive immigration policies, if enacted on a significant scale, would disrupt this equilibrium, forcing companies to navigate higher costs, slower innovation, and reduced flexibility. For investors, recognizing these risks is essential to understanding the delicate balance that supports today’s elevated valuations.
Labor Markets and Fed Policy: A Cautious View
As we approach 2025, it’s worth reflecting on the shifting dynamics in labor markets and their implications for Fed policy and the broader economy. While the stock market continues to set new records, it’s not clear why investors remain so confident that the Fed’s tightening cycle is nearly complete. The unemployment rate is hovering near its highest level of the year, and the outlook for residential construction—a key economic driver—is darkening.9

The divergence in housing starts from completed units is not one that should be taken lightly, particularly when the number of units under construction continues to trail off as well. When you take a look at the residential construction employment environment, it’s a natural dot to connect that these trends above could manifest pretty quickly in the chart below: 10

The risks heading into 2025 are increasingly skewed to the downside. A single weak jobs report could push the unemployment rate to a new cycle high, casting doubt on the labor market’s resilience and reigniting concerns about economic growth. In such a scenario, markets could see a swift correction, potentially within weeks, as investors recalibrate expectations.
Two years ago, in 2022, the consensus narrative was dominated by recession fears. I took the contrarian view, noting that labor markets were fundamentally strong. Today, the consensus is far more optimistic about growth, even as evidence suggests that labor markets are cooling. This time, I find myself on the more cautious side of the debate.
As we await the outcome of tomorrow’s FOMC meeting, the market seems largely convinced that the Fed will signal a pause after its December meeting. However, I’m not so certain. The real risk isn’t just that the Fed pauses—it’s that any pause could prove short-lived if the labor market continues to deteriorate. In such a scenario, the Fed may find itself forced back into action, extending an already complex tightening cycle.
For investors, this environment calls for vigilance and an appreciation of the nuances in both economic data and policy responses. While risks abound, so too do opportunities for those willing to dig deeper into the trends shaping labor markets and monetary policy.
Can $275 in Earnings Save the Day?
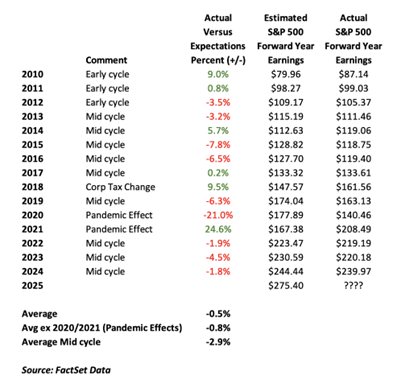
The S&P 500’s forward earnings estimate for 2025 is $275/share, a 15% jump from this year’s near-final tally of $240/share. If that number sounds lofty, it’s worth noting that analysts tend to overestimate earnings during mid-cycle expansions by about 3-5%.11

Adjusting for that bias, we’re likely looking at $261–$267/share, implying 9–11% growth—a rate consistent with 2024.12

In short, the Street’s number may be ambitious, but unless there’s an exogenous shock, the reality should land close enough to support current valuations.
American Exceptionalism
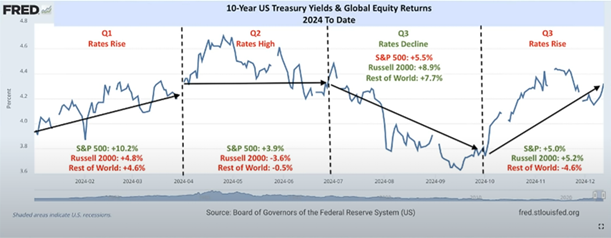
This year’s equity performance has been a study in contrasts, shaped as much by interest rates as by investor psychology. One observation stands out: when rates fall, the rest of the world takes center stage—but only briefly.
The data tells the story. In Q3, when rates finally declined, non-US equities (measured by the ACWI ex-US) and small caps (Russell 2000) delivered their best relative performance of the year, outpacing the S&P 500 with 8-9% returns versus 6%. It was a fleeting moment of global optimism, sparked by hopes of stable growth and reduced borrowing costs.13

[12] Data provided by FactSet.
[13] Chart provided by DataTreck.
But the broader picture is less kind to non-US stocks. In Q1, Q2, and Q4—periods of rising or persistently high rates—the S&P 500 outperformed, proving resilient regardless of rate direction. By year-end, the S&P was up a staggering 25%, compared to just 6% for the rest of the world. This contrast highlights how non-US equities often function as the “stub equity of global markets,” heavily reliant on declining rates and strong global economic growth to perform well. Without these supportive conditions, they frequently remain overshadowed.
The takeaway for 2025? If rates decline further, particularly the 10-year yield dropping below 4%, non-US equities may see a window of outperformance. But if rates remain elevated, the message from this year is clear: stick with the consensus trade—US large caps—as they continue to deliver regardless of the rate environment.
As we approach the new year, these dynamics reinforce the importance of diversification and rate-sensitive allocations in navigating an increasingly complex global market.
The Third-Year Question: Can Momentum Continue?
History says it’s not unusual for the S&P 500 to post two consecutive years of gains, and it’s happened more often than you might expect. Since 1928, the index has delivered positive total returns for two straight years 53% of the time—51 instances out of 96 years.14
The real question is what happens next. Here’s where the numbers get interesting. After two consecutive years of gains, the S&P 500 has delivered a positive return in the following year 71% of the time, with an average gain of 9.4%. When the third year is positive, the index has rallied an impressive +18.3% on average. When it’s not, the average decline has been -12.0%, with outliers like 2008 (-36.6%) showing just how wide the range of outcomes can be.15
The drivers of third-year declines are instructive. Historically, when the S&P has stumbled after back-to-back gains, the culprits have been familiar: financial crises (2008), recessions or recession fears (1937, 1946, 1957, 1981, 2000), rising interest rates (1966, 1977, 2022), or geopolitical shocks like the oil embargoes of 1973 and 1990. Most recently, the 2018 decline stemmed from what many considered a Fed policy mistake—tightening monetary conditions too aggressively.
Now, let’s layer on one more observation: consecutive +20% years like we’ve seen in 2023 and 2024 are far less common. The S&P has delivered back-to-back gains of 20% or more just 9 times in the last 96 years—less than 10% of the time. But even in these rare instances, the odds favor continued gains. In the year following two straight 20% returns, the S&P has rallied 67% of the time, with an average gain of 7.0%. The years that turned positive didn’t just eke out modest returns—four out of six instances delivered double-digit gains, including +33.1% in 1997 and +28.3% in 1998.16
The down years? Those were no ordinary setbacks. In 1937, a sharp recession hit. In 2000, the dot-com bubble burst. And in 1977, rising rates and inflation rattled markets. Each case involved conditions that disrupted earnings growth or investor sentiment in a profound way.
So where does that leave us heading into 2025? Momentum matters—a lot. It’s one of the most durable forces in market history. The S&P has demonstrated a remarkable tendency to rally through year-end, and history provides a clear playbook for what happens when stocks have upward momentum late in the year. Since 1980, U.S. equities have posted positive annual returns 82% of the time when they hit their highs in the fourth quarter. Not only that, but when the peak came in Q4, the average total return for the year was a strong +21%.17
We’ve maintained a constructive view on U.S. equities for much of 2024, driven by resilient earnings growth, improving corporate profitability, and a supportive economic backdrop. History suggests the S&P 500’s momentum will continue into year-end, and the odds favor further gains in 2025. The range of outcomes remains wide—economic shocks, geopolitical risks, and policy missteps always loom—but if the past is any guide, markets tend to reward investors who stay the course.
[14-17] Data provided by Bloomberg Database.
Resilience in Focus in 2025
As we look to 2025, the market’s foundation—structurally higher margins, a transformed S&P 500, and resilient earnings—remains strong, even as risks like Fed policy shifts, labor market cooling, and geopolitical tensions loom large.
History suggests that markets often climb these walls of worry, and while the road ahead may not be smooth, momentum, profitability, and innovation remain powerful tailwinds. The task for investors is clear: stay disciplined, remain vigilant, and trust that resilience tends to win out.
If 2024 has taught us anything, it’s that markets reward those who stay the course.
CURRENT MARKET DATA IS AS OF 12/31/2024. OPINIONS AND PREDICTIONS ARE AS OF 12/14/2024 AND ARE SUBJECT TO CHANGE AT ANY TIME BASED ON MARKET AND OTHER CONDITIONS. NO PREDICTIONS OR FORECASTS CAN BE GUARANTEED. INFORMATION CONTAINED HEREIN HAS BEEN OBTAINED FROM SOURCES BELIEVED TO BE RELIABLE BUT IS NOT GUARANTEED.
THIS PRESENTATION (THE “PRESENTATION”) HAS BEEN PREPARED SOLELY FOR INFORMATION PURPOSES AND IS NOT INTENDED TO BE AN OFFER OR SOLICITATION AND IS BEING FURNISHED SOLELY FOR USE BY CLIENTS AND PROSPECTIVE CLIENTS IN CONSIDERING GFG CAPITAL, LLC (“GFG CAPITAL” OR THE “COMPANY”) AS THEIR INVESTMENT ADVISER. DO NOT USE THE FOREGOING AS THE SOLE BASIS OF INVESTMENT DECISIONS. ALL SOURCES DEEMED RELIABLE HOWEVER GFG CAPITAL ASSUMES NO RESPONSIBILITY FOR ANY INACCURACIES. THE OPINIONS CONTAINED HEREIN ARE NOT RECOMMENDATIONS.
THIS MATERIAL DOES NOT CONSTITUTE A RECOMMENDATION TO BUY OR SELL ANY SPECIFIC SECURITY, PAST PERFORMANCE IS NOT INDICATIVE OF FUTURE RESULTS. INVESTING INVOLVES RISK, INCLUDING THE POSSIBLE LOSS OF A PRINCIPAL INVESTMENT.
INDEX PERFORMANCE IS PRESENTED FOR ILLUSTRATIVE PURPOSES ONLY. DIRECT INVESTMENT CANNOT BE MADE INTO AN INDEX. INVESTMENT IN EQUITIES INVOLVES MORE RISK THAN OTHER SECURITIES AND MAY HAVE THE POTENTIAL FOR HIGHER RETURNS AND GREATER LOSSES. BONDS HAVE INTEREST RATE RISK AND CREDIT RISK. AS INTEREST RATES RISE, EXISTING BOND PRICES FALL AND CAN CAUSE THE VALUE OF AN INVESTMENT TO DECLINE. CHANGES IN INTEREST RATES GENERALLY HAVE A GREATER EFFECT ON BONDS WITH LONGER MATURITIES THAN ON THOSE WITH SHORTER MATURITIES. CREDIT RISK REFERES TO THE POSSIBLITY THAT THE ISSUER OF THE BOND WILL NOT BE ABLE TO MAKE PRINCIPAL AND/OR INTEREST PAYMENTS.
THE INFORMATION CONTAINED HEREIN HAS BEEN PREPARED TO ASSIST INTERESTED PARTIES IN MAKING THEIR OWN EVALUATION OF GFG CAPITAL AND DOES NOT PURPORT TO CONTAIN ALL OF THE INFORMATION THAT A PROSPECTIVE CLIENT MAY DESIRE. IN ALL CASES, INTERESTED PARTIES SHOULD CONDUCT THEIR OWN INVESTIGATION AND ANALYSIS OF GFG CAPITAL AND THE DATA SET FORTH IN THIS PRESENTATION. FOR A FULL DESCRIPTION OF GFG CAPITAL’S ADVISORY SERVICES AND FEES, PLEASE REFER TO OUR FORM ADV PART 2 DISCLOSURE BROCHURE AVAILABLE BY REQUEST OR AT THE FOLLOWING WEBSITE: HTTP://WWW.ADVISERINFO.SEC.GOV/.
ALL COMMUNICATIONS, INQUIRIES AND REQUESTS FOR INFORMATION RELATING TO THIS PRESENTATION SHOULD BE ADDRESSED TO GFG CAPITAL AT 305-810-6500.