“These are companies that aren’t going anywhere, why wouldn’t I keep doing this?” Every bit of that thought process is incredibly detrimental to a long-term investor’s portfolio. That was a question posed to us while discussing the use of LEAPS (Long Term Equity Anticipation Securities), a.k.a. long-dated options, on select companies in today’s market. From an execution point of view, the (successful) use of LEAPS requires a lot of luck, a little skill and a high tolerance of risk. But our takeaway, and the point we think is worth making, wasn’t so much the use of the securities. But it was the dangers of extrapolating the present into the future. Like the universe itself, the market is continuously changing. A little bit of history can show us that the one constant throughout time is nothing remains the same.
STAYING POWER
The starting point for most investors (in the U.S.) typically is the S&P 500. This index is oftentimes synonymous with “the market” as it represents ~80% of the U.S. investible universe1. While most investors are probably better off with exposing themselves to the entire market in order to capture adequate beta at the lowest cost available, many try to partake in the pastime of selecting individual stocks. Our team is well aware of the time and effort required to effectively position your portfolio with strategic single-company exposures as well as the low success-rate many investors have experienced in picking the right individual names. However, many investors sell this concept short. Whether they choose to ignore the work that is commanded by selecting a single stock or think picking winners is simple, it is a bit beyond us. But there’s a trap that many investors fall into when they embark on.
“Why not just pick the biggest companies? They’ll be there when I wake up tomorrow, right?” The survivorship and recency bias on display with this concept is overwhelming. In other words: “Whoever is the biggest company today is certain to maintain their relative size and competitive advantages moving forward because their economies of scale are just too much to handle for the market.” We’re not even sure we can extract any sense from this in theory. But in reality, this train of thought is one routinely exposed by the market. This is part of our infatuation with the capital market system. Unapologetic punches to the face once you think you have a game plan. It’s like Ben Graham’s “Mr. Market” is the finance equivalent of Mike Tyson. No system in the world demands accountability in the relentless way markets do. Trends change, economies evolve, technology disrupts. Each and every day new ideas take the step from thought to plan to action. Over the years, we’ve seen this illustrated by the market itself and that has cemented our belief that nothing is permanent.
EVOLUTION OF MARKETS
History of markets has shown us that the average lifespan of an S&P 500 constituent has significantly fallen off over the last 50 years. In 1965 the average lifespan of a constituent was 33 years2. A company would enjoy a period of 33 years of being included in what’s considered one of the most widely followed equity indices in the world. Imagine if index funds and ETFs existed back then the way they do today. The access to capital probably could have extended this impressive run for most.
But fast forward to 1990 and the average company remained in the index for 20 years. Some forecast this average life to shrink to 14 years over the next decade3. What gives? Well for starters, technology. Without getting completely neoclassical about all of this, the most obvious trend over this period is the disruption that new technology and technological discoveries have had on the market and our economies. Of course, these are ideas that nobody could have fathomed in the ‘80’s or 90’s. Well, almost nobody. Clearly somebody could have.
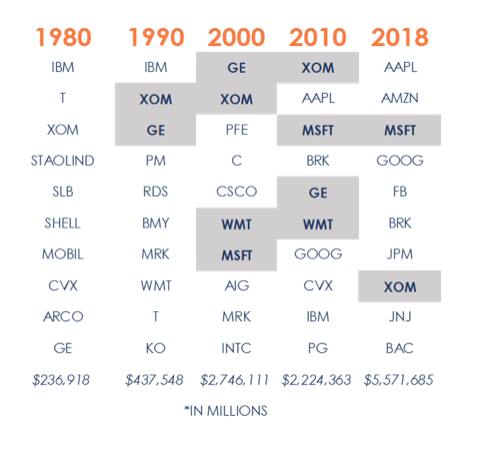
But getting back to the original argument, what about honing in on the biggest companies? It’s a market cap weighted index after all, so size must matter. Almost, but still a flawed approach. Here’s a look at the ten largest companies by market cap within the index dating back to 1980 in 10-year intervals:

You likely could have looked at those ten companies at the end of 1980 and made a compelling case as to how each one of them possessed a uniquely strong story and was deeply engrained into the U.S. economy. Not just 12 months later would you be left with a list of ten names that featured two new members (GM and Kodak) and the ranking in size would have been totally different.
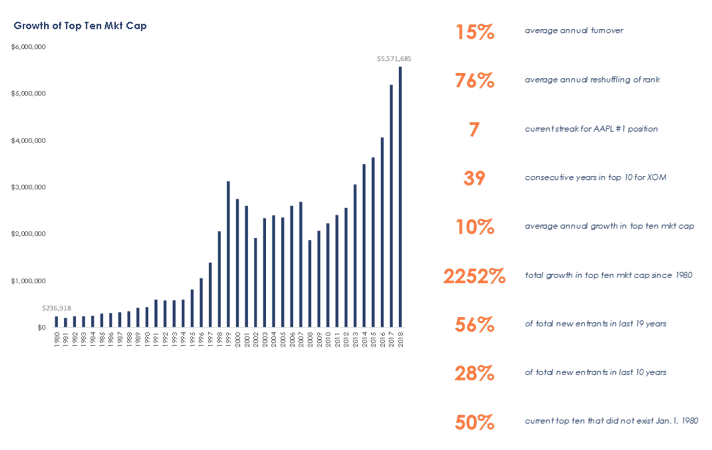
Looking at the list at present day, 90% of the names in the top ten largest companies in the index were not featured in 1980’s list. In fact, the five largest didn’t even exist on January 1, 1980. Another impressive note that can be taken from above is the tremendous difference in market capitalization. Not only is there a clear dynamic nature to the top ten largest names, but extraordinary value creation. Clearly, this growth isn’t exclusive to the top of the list but the market as a whole. But break this down for a minute. In 1980 an investor could have been looking at those names and reasonably expected they’d maintain their relative size to the market to a certain extent over the long term. Here we are today, and the list is dominated by five companies that as a group have a total market capitalization 16x that of the entire list of ten from 40 years ago. Oh, and they’re all younger than 40 years.
Here are some other interesting stats on the 42 different companies that ranked in the top ten largest market caps over the last 38 years:

We as humans have a tendency to see what is right in front of our faces and become completely consumed by it. But when it comes to investing, and in particular investing in single stocks, limiting our vision to the top of the list is no guarantee of outperformance. Pledging one’s loyalty to the giants of today is by no means a way to guarantee investing success for the future. In fact, it’s proven to be a surefire way to be left behind.
Download the PDF here.
SOURCE: This presentation is solely for informational purposes and should not be taken as investment advice. For further information, please contact one of our investment adviser representatives. Graphs provided by GFG Capital. Data provide by Bloomberg. 1 Morningstar.2 Innosight. 3 Innosight.
LEGAL STUFF
THIS PRESENTATION (THE “PRESENTATION”) HAS BEEN PREPARED SOLELY FOR INFORMATION PURPOSES AND IS NOT INTENDED TO BE AN OFFER OR SOLICITATION AND IS BEING FURNISHED SOLELY FOR USE BY PROSPECTIVE CLIENTS IN CONSIDERING GFG CAPITAL, LLC (“GFG CAPITAL” OR THE “COMPANY”) AS THEIR INVESTMENT ADVISOR. THE OPINIONS CONTAINED HERIN ARE NOT RECOMMENDATIONS.
THE INFORMATION CONTAINED HEREIN HAS BEEN PREPARED TO ASSIST INTERESTED PARTIES IN MAKING THEIR OWN EVALUATION OF GFG CAPITAL AND DOES NOT PURPORT TO CONTAIN ALL OF THE INFORMATION THAT A PROSPECTIVE CLIENT MAY DESIRE. IN ALL CASES, INTERESTED PARTIES SHOULD CONDUCT THEIR OWN INVESTIGATION AND ANALYSIS OF GFG CAPITAL AND THE DATA SET FORTH IN THIS PRESENTATION. FOR A FULL DESCRIPTION OF GFG CAPITAL’S ADVISORY SERVICES AND FEES, PLEASE REFER TO OUR FORM ADV PART 2 DISCLOSURE BROCHURE AVAILABLE BY REQUEST OR AT THE FOLLOWING WEBSITE: HTTP://WWW.ADVISERINFO.SEC.GOV/.
ALL COMMUNICATIONS, INQUIRIES AND REQUESTS FOR INFORMATION RELATING TO THIS PRESENTATION SHOULD BE ADDRESSED TO GFG CAPITAL AT 305-810-6500.