

 Coming off one of the greatest statistical anomaly calendar years for U.S. equities in 2017 (virtually zero volatility), the first three months of 2018 followed suit with its own unique environment for multi-asset investors (stocks, bonds and commodities all finished lower). What did the second quarter have in store? A bit of normality. Both equities and bonds experienced their moments of strength and weakness over the second quarter, but ultimately etched out moderately positive returns for the period. Stretching across the first 180 days of the year, markets have largely behaved how one should expect coming off an exceptionally strong, quiet previous 12 months. A bit of uncertainty in pricing action which turns into much-needed and welcomed consolidation. This is an integral part of markets’ cyclical nature in order for them to not get too far ahead of themselves. There has been no shortage of headlines, and a handful of tangible catalysts and headwinds, that have been thrown at investors so far this year. None more notable than the conversation of global trade. An immensely complex subject, investors have been forced to consider what the implications of a trade war could be to their portfolios and the global economy. A subject that isn’t as simple as reported trade deficits and surpluses, this is no small task for investors to try to breakdown and ultimately decide how to respond. Or if they even should. We believe the subject of global trade carries significant global economic implications. The best way to defend or prepare one’s portfolio from this event, or even benefit, is to stick to their personal investment plan and to continue to act on facts, not headlines.
RECENT MARKET DRIVERS
Economic Growth Focus Returning Home
After the first quarter we spoke about the market’s lack of enthusiasm with the global growth story as the market was demanding receipts for promises it had already paid for. We want to take this period to highlight some of the evidence and economic fundamentals here in the U.S. that should soften some of the noise coming through the airwaves today.
Straight to the Facts
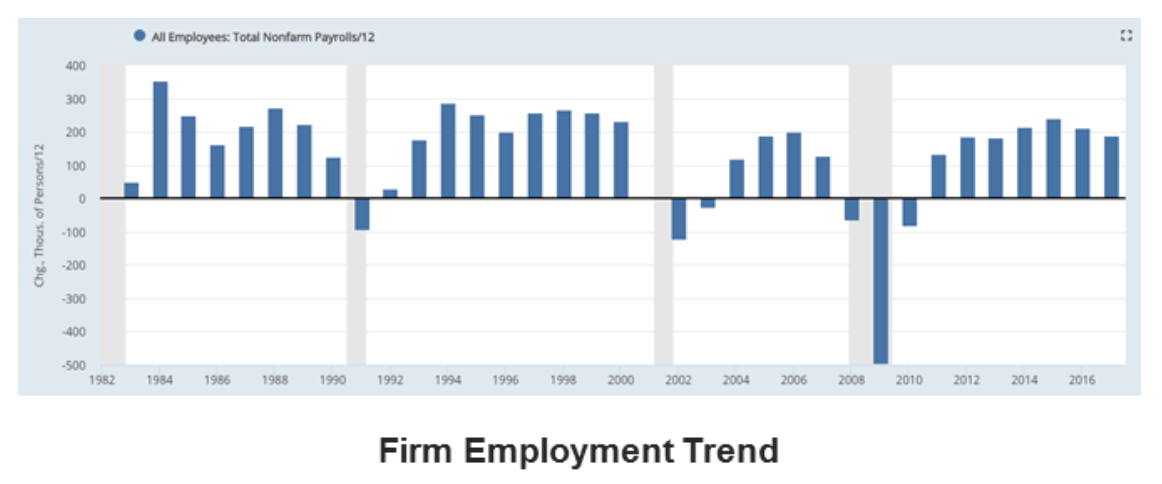
Chart provided by Federal Reserve Economic Data (FRED).
At the end of the quarter, we were receiving a slew of economic data depicting a strong underbelly of the economy. This is a trend that has persisted with little signs of interruption since the beginning of the expansion. Some of the most prominent readings that command investors’ attention perhaps more so than others came in as solid as one could hope. Here are some highlights1:
Monthly employment gains have averaged 197,000 during the past year, with annual growth of 1.6% YoY. Employment has been driven by full-time jobs, which rose to a new all-time high in June. A trend that has been welcomed in contrast to the part-time employment trend that had swept the country.

Chart provided by Federal Reserve Economic Data (FRED).
Compensation growth is on an improving trend. Hourly wage growth was 2.7% YoY in June, while the 1Q18 employment cost index grew 2.9% YoY, the highest growth in the past 10 years. However, we will point out this growth narrowly edges out inflation.
Real demand growth has been 2-3%. In May, real personal consumption growth was 2.3%. Real retail sales (excluding food) grew 3.2% YoY in May, making a new all-time highs. 1Q18 GDP final reported growth was the highest in nearly three years. New home sales grew 14% YoY in May. Housing starts were at the highest level of the past 11 years in May, rising 20% YoY. Multi-family units remain a drag on overall development. Core durable goods rose 5.5% YoY in May.
The manufacturing component of industrial production grew 1.9% YoY in May. Both measures were at the highest level in 10 years in April. The core inflation rate remains near the Fed’s 2% target.
Macro>Micro
We are firm believers that keeping the big picture in mind and thinking long term yields the greatest outcome. Not only in investing, but in life. Exercising patience and tolerance are not only characteristics important for your day to day, but also your portfolio. That being said, we encourage investors to take the end of a quarter to step back and make sure they haven’t lost sight of the forest for the trees. Understanding where we’ve come from and how we got to this position we’re in is arguably more important than trying to decipher endless inputs we’re given each and every day.
Long-Run Relationships
We certainly agree that the day-to-day movement in the market is not a day-to-day indicator of the health of the broader economy. But over the long term, these two are typically in a strong long-term relationship. The stock market is usually a good indicator of what’s to come in the economy, not what just happened. Or even what’s happening in present time. As the current economic expansion continues to age, although still healthy as just pointed out, we can start to pay closer attention to history for some insight into the future. While price corrections (a drop of 10%) are healthy and should be expected to be normal occurrences in an extended bull market, bear markets (decline of 20%) have almost always occurred during periods of prolonged economic weakness. Further evidence that markets and economies might deviate in the short term, but over the long run they tend to have a clear line of communication.
All 7’s
The previous seven economic recessions were all prefaced with unemployment claims bottoming, the yield curve becoming inverted and a peak in the S&P 500’s price. Meaning, typically the breakdown of some key indicators leads to forward expectations becoming tempered with the equity market peaking prior to the recession making its way through the economy. Today, we aren’t seeing these key indicators break down as the data continues to pour in.
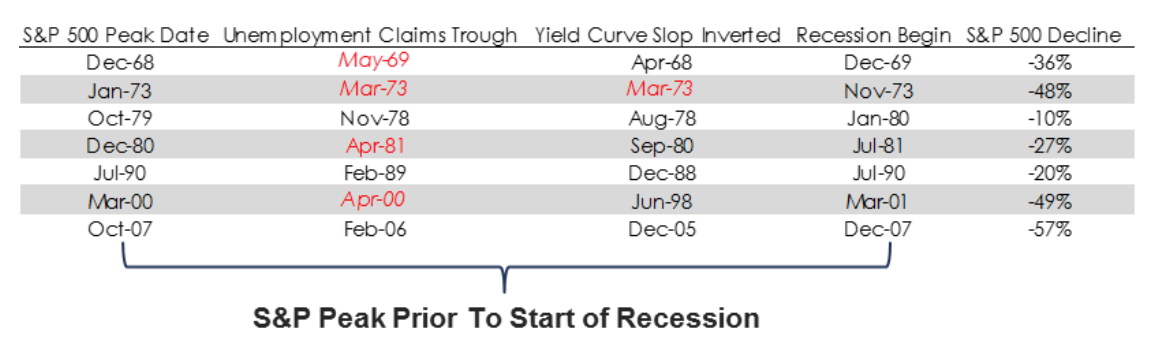
Chart provided by Federal Reserve Economic Data (FRED).
With endless talk surrounding the yield curve (we warned you) we’re still in the “flattening” phase. Without a bushel of evidence to justify an end to this bull market run, we do not think we’ve seen the peak in the market just yet.
I Dip You Dip We Dip
We reiterate almost daily, certainly quarterly, as earnings grow, the price of equity assets tends to grow with them. When it comes to the economy and the stock market: as consumption grows (~70% GDP) as does the equity market. With consumption as measured by retail sales continues to climb, we view the macro, long-term trend of the economy still projecting a positive signal.
Trade
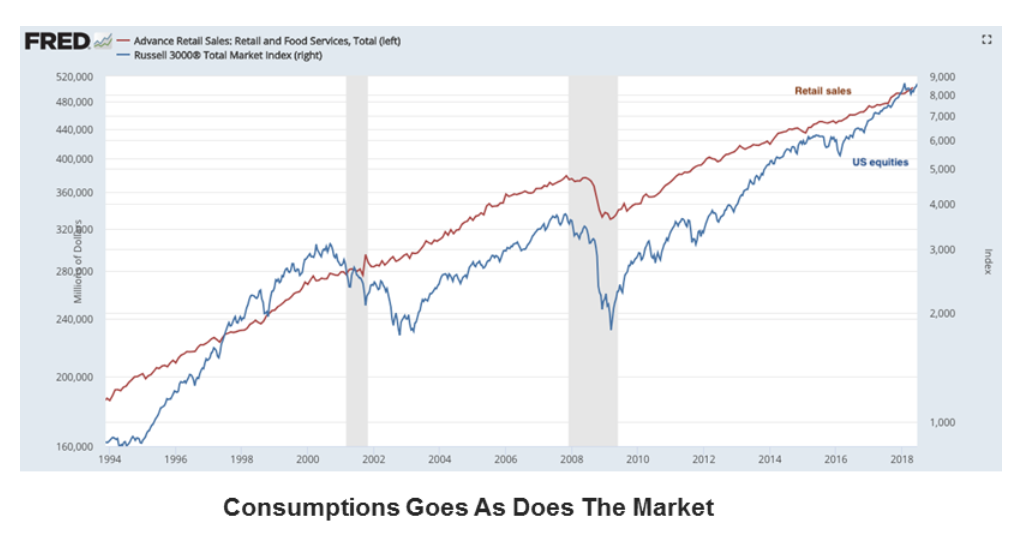
Chart provided by Federal Reserve Economic Data (FRED).
The gorilla in the room for this conversation is the escalating trade negotiations taking place across the globe. We’ve referenced this topic as a true risk to not only the United States’ growth trajectory, but the global economy’s. No matter what way you slice it, there is no winner in a trade war. And attempting to benefit from it strategically in your portfolio is not as clear cut as it might seem. International trade is a tangled web that would drive Charlotte into an anxiety attack. Some of the biggest industries in our economy create their products with hundreds of international companies as trade partners. The clearest losers are the producers of single product that are largely an import for foreign economies that now face tariffs. Which is why you see so much attention paid to agriculture and materials. It’s a lot tougher, and virtually impossible, to dissect the geographic supply chain of some of the largest industries in the world. All we as investors can do is not lose sight of the bigger picture. The longer these talks are drawn out, the choppier we can expect the market to be. We show up each day to the market with a built-in excuse for this price behavior. It’s a bull’s nightmare. Without substantial evidence that has made its way through the economy just yet, we can’t justify any dramatic changes to an allocation. What are some of the signals? Well, aside from the ones outlined above, history (and the Federal Bank of St. Louis) will tell us that when a country increases its tariffs by at least 3.5% in one-year imports as a percent of GDP decline by 2.5%, wages fall by close to 2% and investment-to-GDP declines by 1%2. All very important aspects to keep this specific expansion running. That’s what we’ll be keeping our eye on in the next 180 days as this trade war continues to unfold.
For our full quarterly report, click here.
SOURCE: This presentation is solely for informational purposes and should not be taken as investment advice. For further information, please contact one of our investment adviser representatives. Charts provided by Federal Reserve Economic Data (FRED).1 FRED. 2 Federal Reserve Bank of St. Louis. Study conducted for the period 1980-2006.
LEGAL STUFF
THIS PRESENTATION (THE “PRESENTATION”) HAS BEEN PREPARED SOLELY FOR INFORMATION PURPOSES AND IS NOT INTENDED TO BE AN OFFER OR SOLICITATION AND IS BEING FURNISHED SOLELY FOR USE BY CLIENTS AND PROSPECTIVE CLIENTS IN CONSIDERING GFG CAPITAL, LLC (“GFG CAPITAL” OR THE “COMPANY”) AS THEIR INVESTMENT ADVISOR. THE OPINIONS CONTAINED HEREIN ARE NOT RECOMMENDATIONS.
THE INFORMATION CONTAINED HEREIN HAS BEEN PREPARED TO ASSIST INTERESTED PARTIES IN MAKING THEIR OWN EVALUATION OF GFG CAPITAL AND DOES NOT PURPORT TO CONTAIN ALL OF THE INFORMATION THAT A PROSPECTIVE CLIENT MAY DESIRE. IN ALL CASES, INTERESTED PARTIES SHOULD CONDUCT THEIR OWN INVESTIGATION AND ANALYSIS OF GFG CAPITAL AND THE DATA SET FORTH IN THIS PRESENTATION. FOR A FULL DESCRIPTION OF GFG CAPITAL’S ADVISORY SERVICES AND FEES, PLEASE REFER TO OUR FORM ADV PART 2 DISCLOSURE BROCHURE AVAILABLE BY REQUEST OR AT THE FOLLOWING WEBSITE: HTTP://WWW.ADVISERINFO.SEC.GOV/.
ALL COMMUNICATIONS, INQUIRIES AND REQUESTS FOR INFORMATION RELATING TO THIS PRESENTATION SHOULD BE ADDRESSED TO GFG CAPITAL AT 305-810-6500.